Fig. A.1.
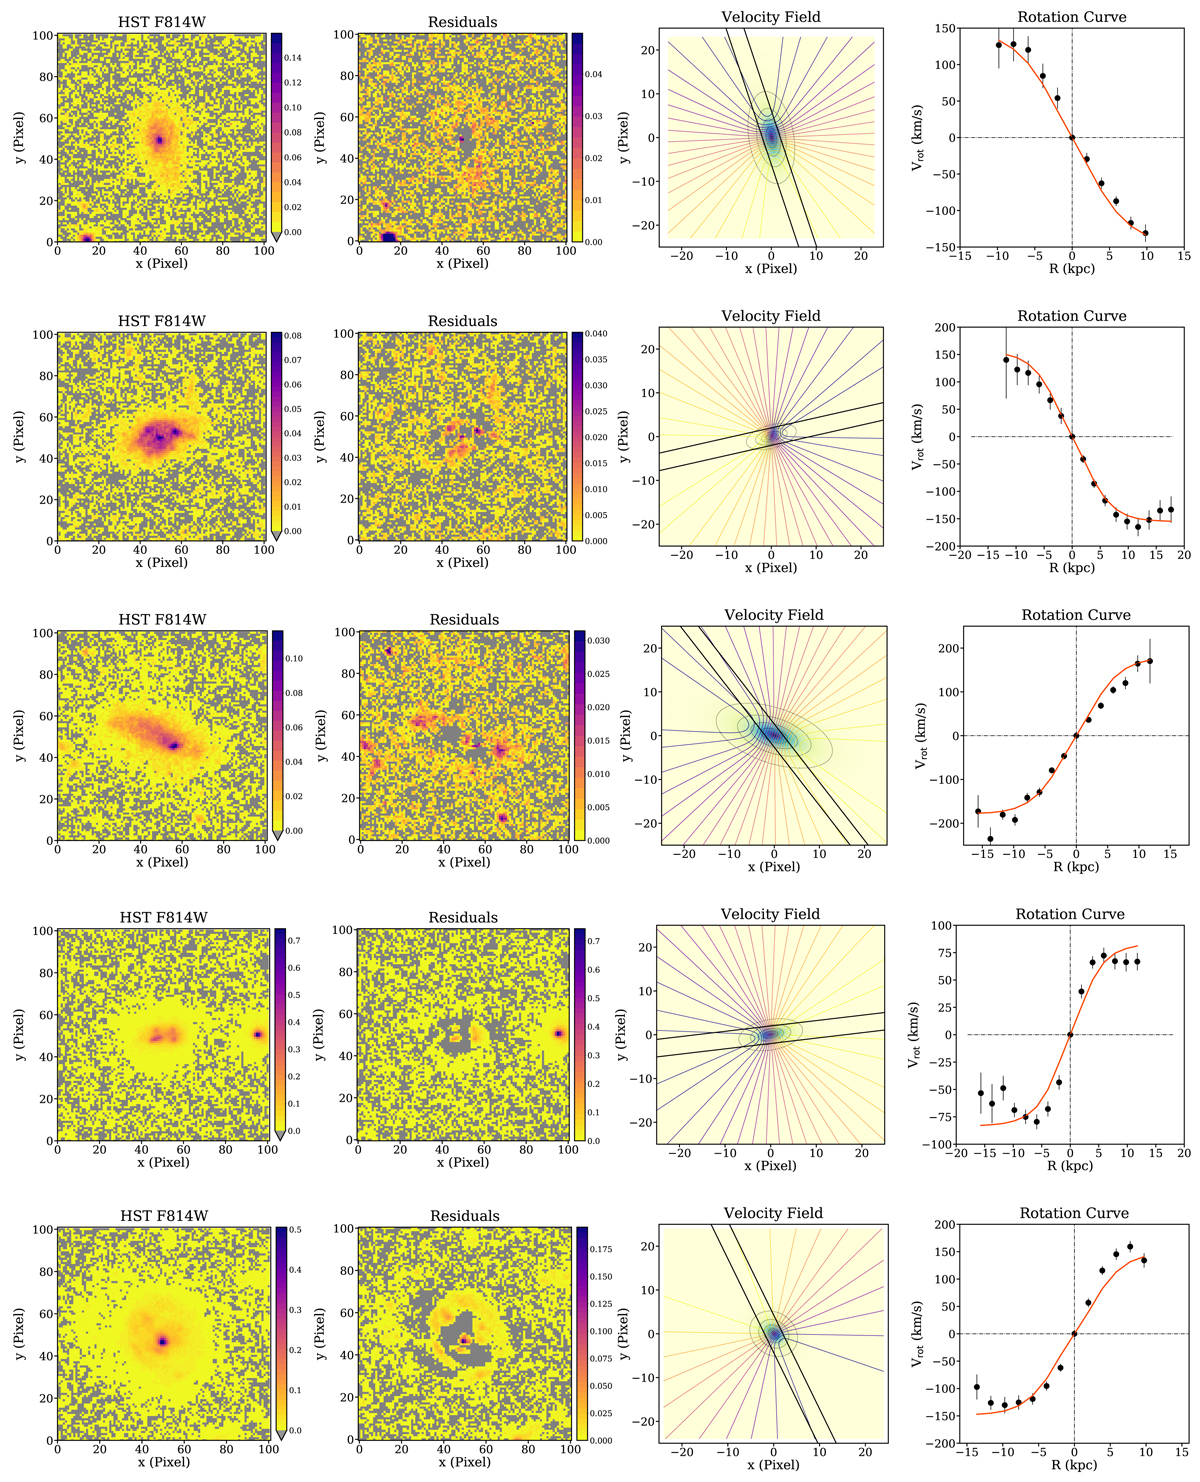
CL1604 sample of galaxies introduced in Sect. 3 and presented in the same order as in Table A.1. The first and second columns show the original HST-F814W or HSC-z-band images centered on the targets and their residuals after subtracting the 2D model of the galaxies. The pixel scale in the first column corresponds to 0.05″ pix−1 for HST images and 0.2″ pix−1 for HSC images. The third column presents the synthetic velocity field after fitting the simulated rotation curve to the observed curve (assuming the pixel scale of OSIRIS, i.e., 0.25″ pix−1). The solid black parallel lines depict the edges of the slit. The fourth column displays the observed (black dots) and modeled (red line) rotation curve.
Current usage metrics show cumulative count of Article Views (full-text article views including HTML views, PDF and ePub downloads, according to the available data) and Abstracts Views on Vision4Press platform.
Data correspond to usage on the plateform after 2015. The current usage metrics is available 48-96 hours after online publication and is updated daily on week days.
Initial download of the metrics may take a while.