Fig. 9
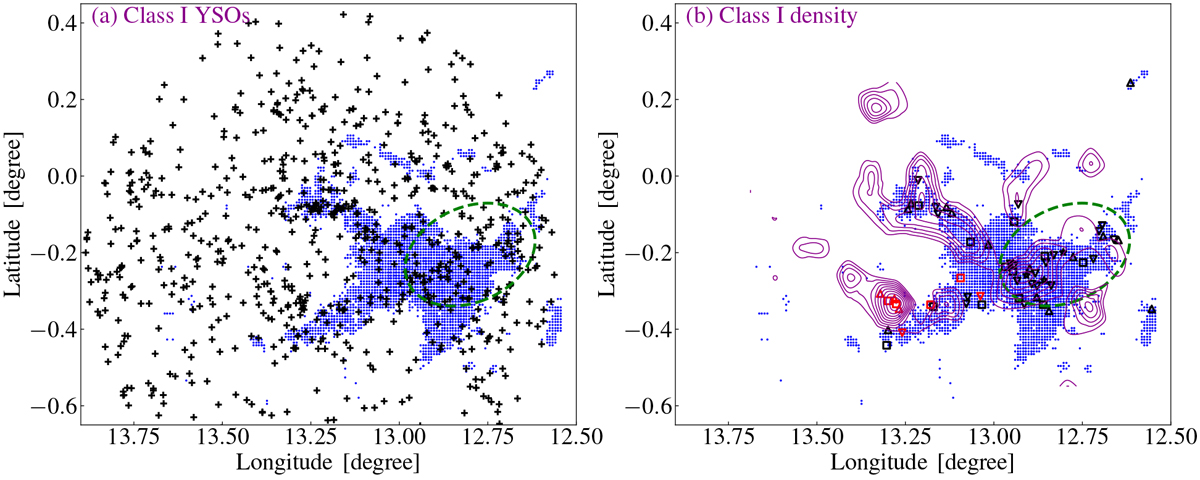
Panel a: Class I YSOs marked by plus symbols overlaid on the C18O (1–0) emission. Panel b: corresponding overlay of Class I YSOs surface density contours on the C18 O (1–0) emission. The contour levels start from 0.5 to 1.7 pc−2 (magenta contours) in steps of 0.13 pc−2. The different symbols represent the clumps in different stages, similar to those in Fig. 5a. In addition, the clumps marked with the red colour are in the velocity range of 38.5–42 km s−1.
Current usage metrics show cumulative count of Article Views (full-text article views including HTML views, PDF and ePub downloads, according to the available data) and Abstracts Views on Vision4Press platform.
Data correspond to usage on the plateform after 2015. The current usage metrics is available 48-96 hours after online publication and is updated daily on week days.
Initial download of the metrics may take a while.