Free Access
Fig. 8
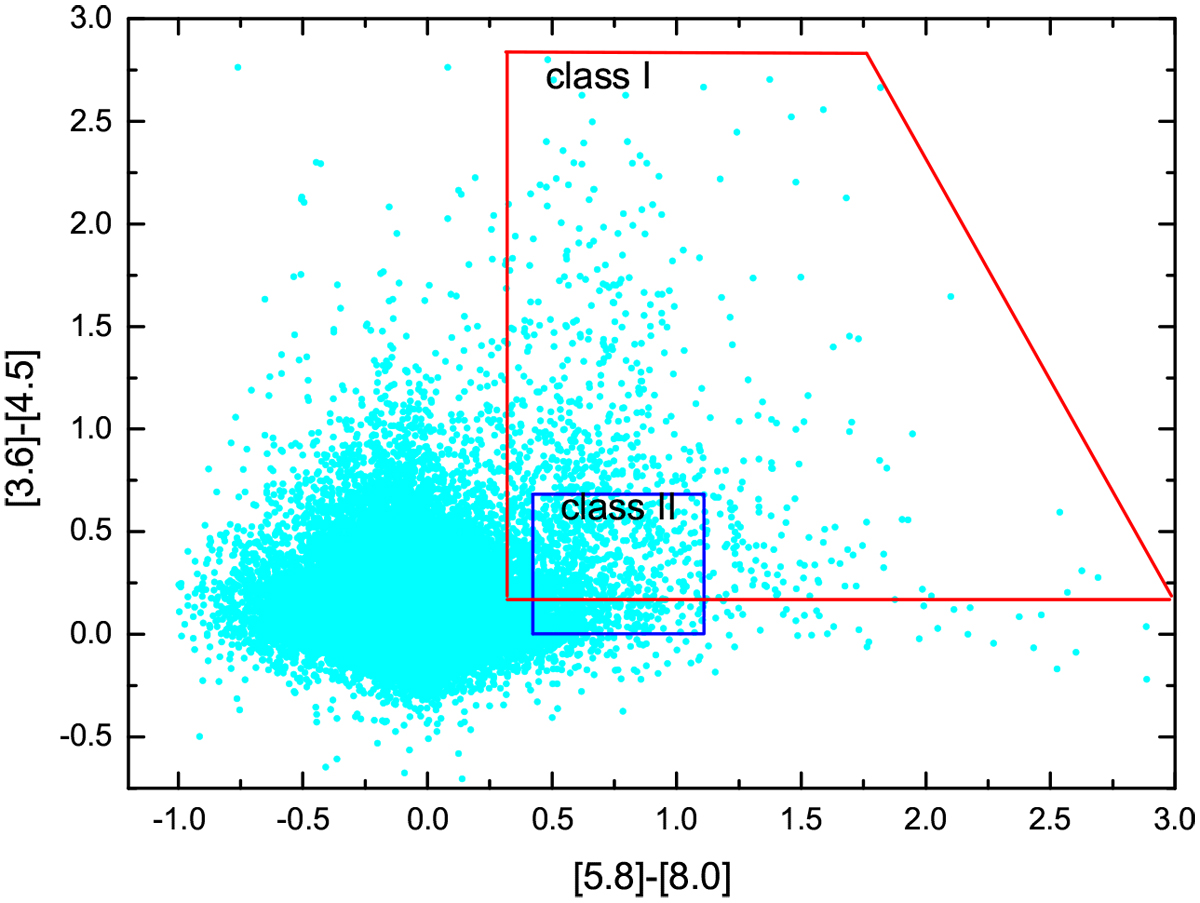
IRAC colour–colour plot for the sources in our observational region. The regions indicated the stellar evolutionary stage as defined by Allen et al. (2004). Class I sources represent protostars with circumstellar envelopes and Class II are disc-dominated objects.
Current usage metrics show cumulative count of Article Views (full-text article views including HTML views, PDF and ePub downloads, according to the available data) and Abstracts Views on Vision4Press platform.
Data correspond to usage on the plateform after 2015. The current usage metrics is available 48-96 hours after online publication and is updated daily on week days.
Initial download of the metrics may take a while.