Fig. 7
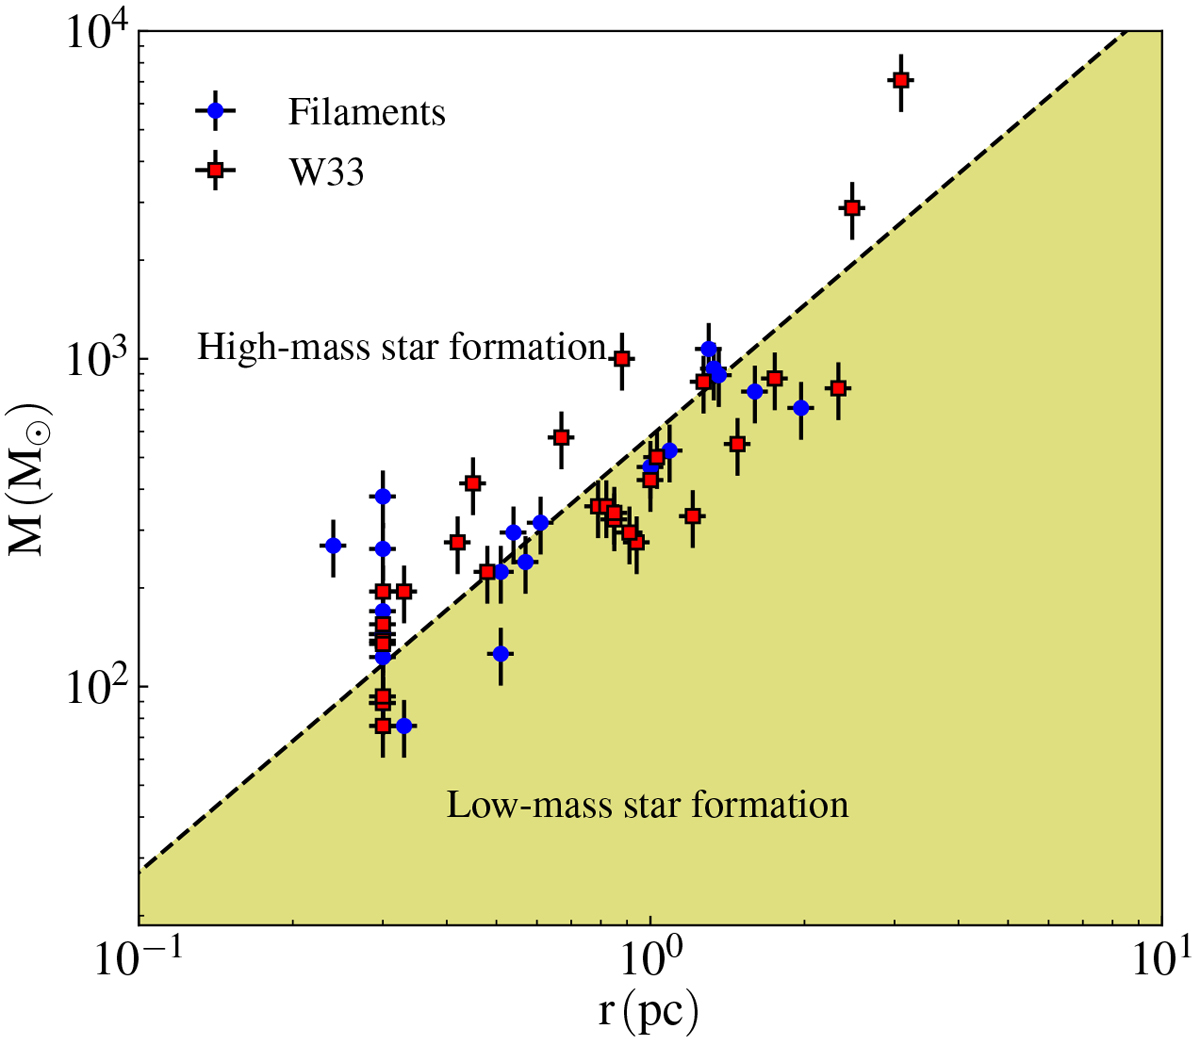
Mass–size relationship of the clumps with masses determined. The yellow shaded region represents the parameter space devoid of massive star formation, where
![]() (Kauffmann & Pillai 2010). The red squares represent the clumps in the central hub W33 and the blue circles mark the clumps in the filaments. The errors on the masses and radii of the clumps are
~ 20 and ~ 6%, respectively,from Urquhart et al. (2018).
(Kauffmann & Pillai 2010). The red squares represent the clumps in the central hub W33 and the blue circles mark the clumps in the filaments. The errors on the masses and radii of the clumps are
~ 20 and ~ 6%, respectively,from Urquhart et al. (2018).
Current usage metrics show cumulative count of Article Views (full-text article views including HTML views, PDF and ePub downloads, according to the available data) and Abstracts Views on Vision4Press platform.
Data correspond to usage on the plateform after 2015. The current usage metrics is available 48-96 hours after online publication and is updated daily on week days.
Initial download of the metrics may take a while.