Fig. 5
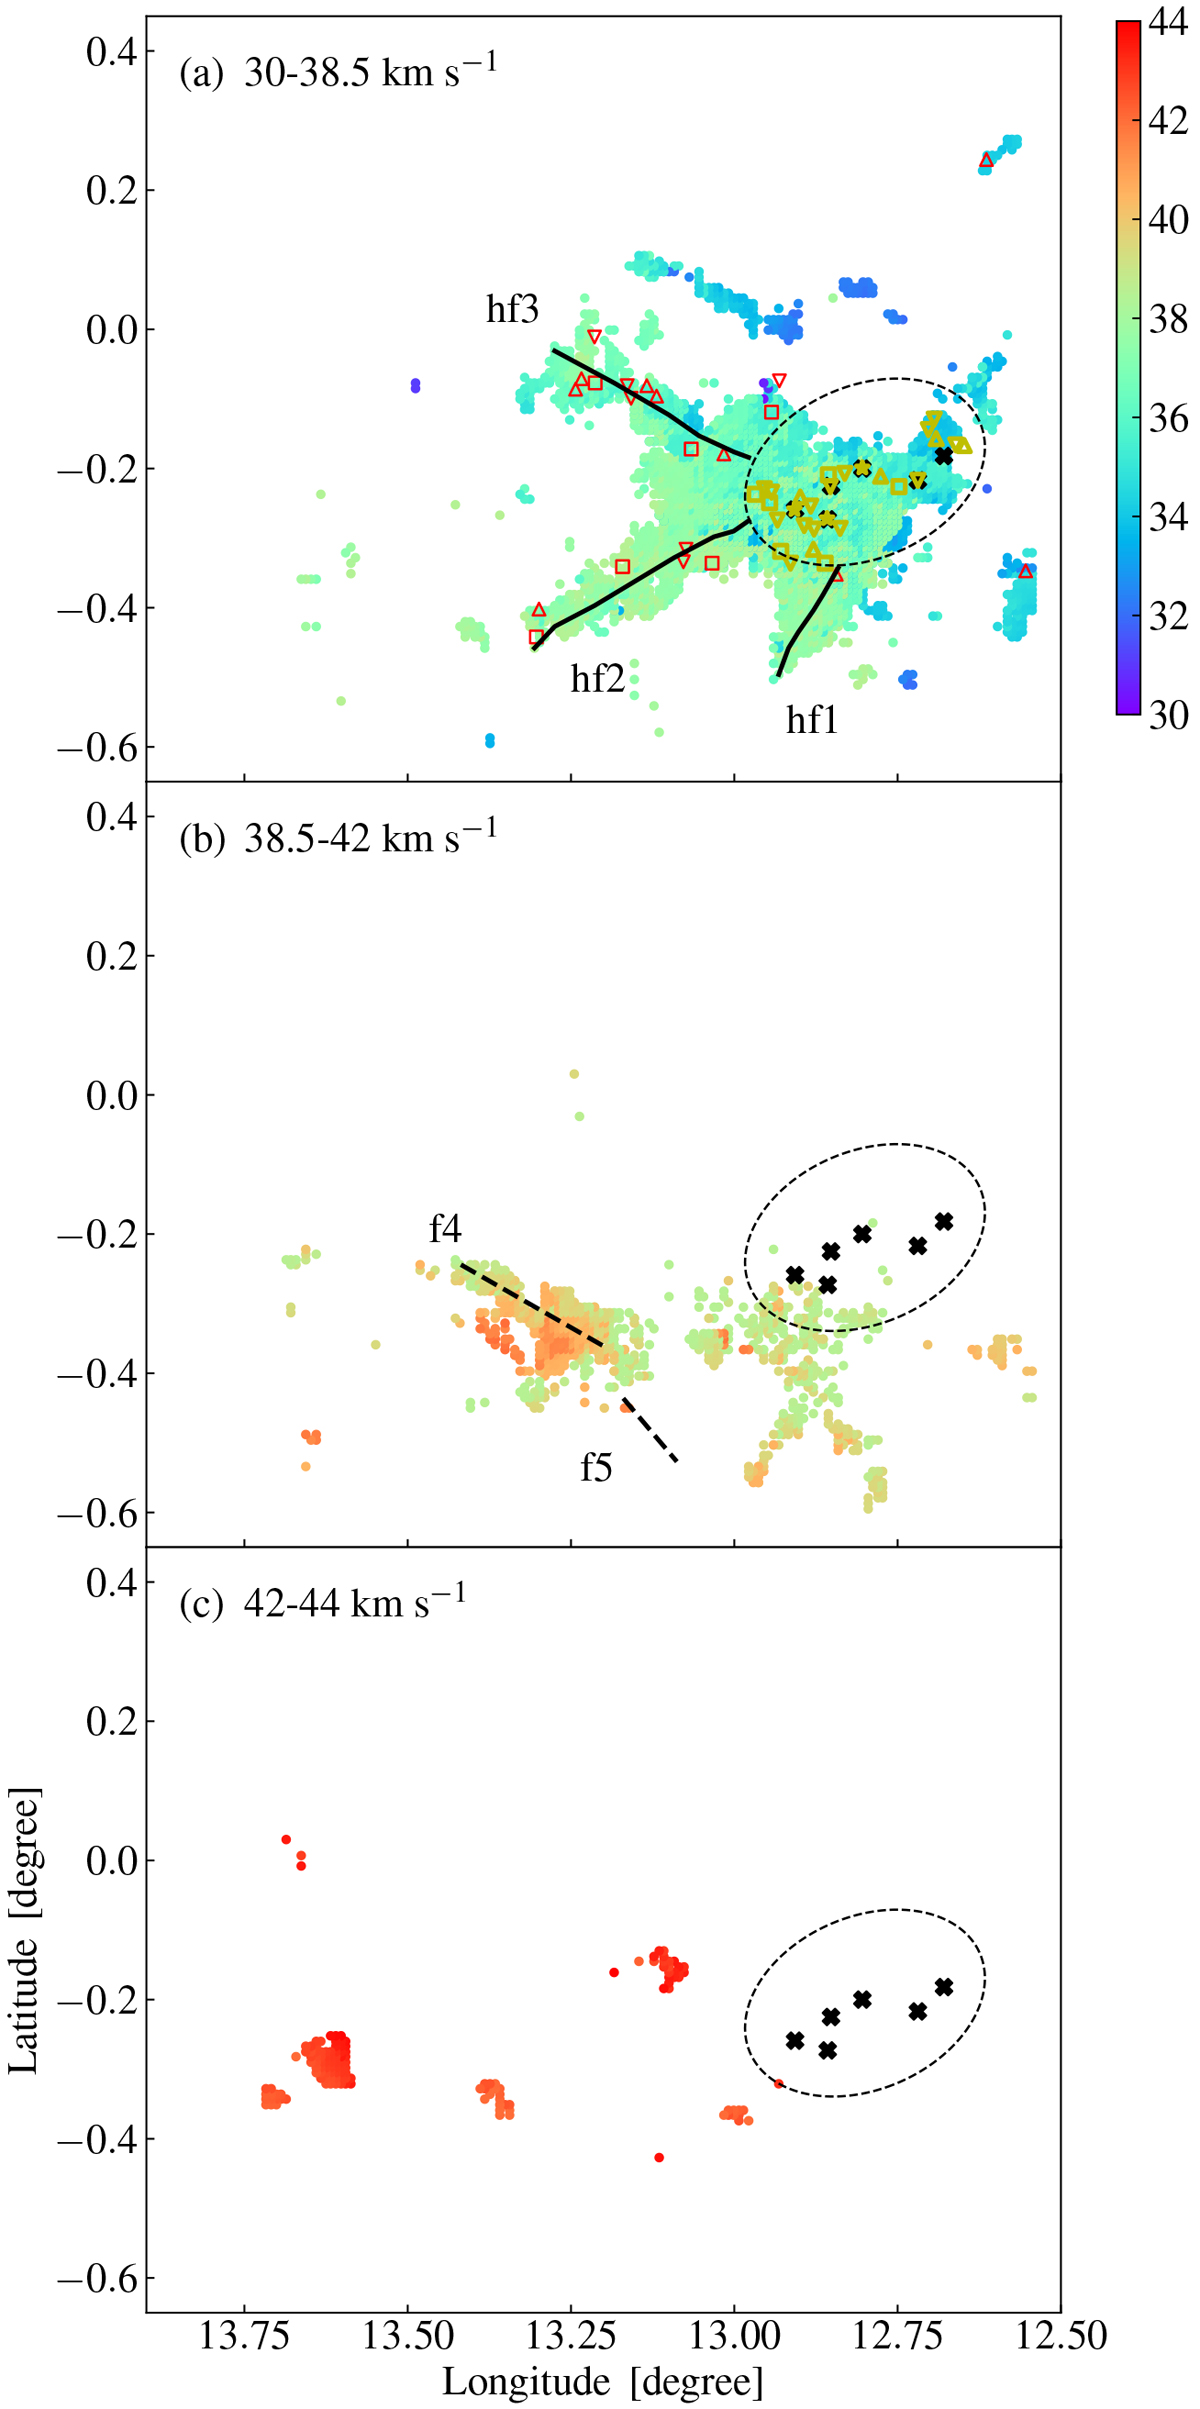
Velocity distributions in 30–38.5 km s−1 (panel a), 38.5–42 km s−1 (panel b), and 42–44 km s−1 (panel c), respectively. The points are coloured with the velocity values shown in the right colour bar. The asterisks represent the MSF clumps, ‘▽’ mark the YSO clumps, ‘△’ flag the protostellar clumps, and the squares are for the quiescent clumps. The black lines denote the spines of the filaments hf1, hf2, and hf3. The clumps are coded with different colours in the W33 complex (yellow) and in the filaments (red), respectively.
Current usage metrics show cumulative count of Article Views (full-text article views including HTML views, PDF and ePub downloads, according to the available data) and Abstracts Views on Vision4Press platform.
Data correspond to usage on the plateform after 2015. The current usage metrics is available 48-96 hours after online publication and is updated daily on week days.
Initial download of the metrics may take a while.