Fig. 4
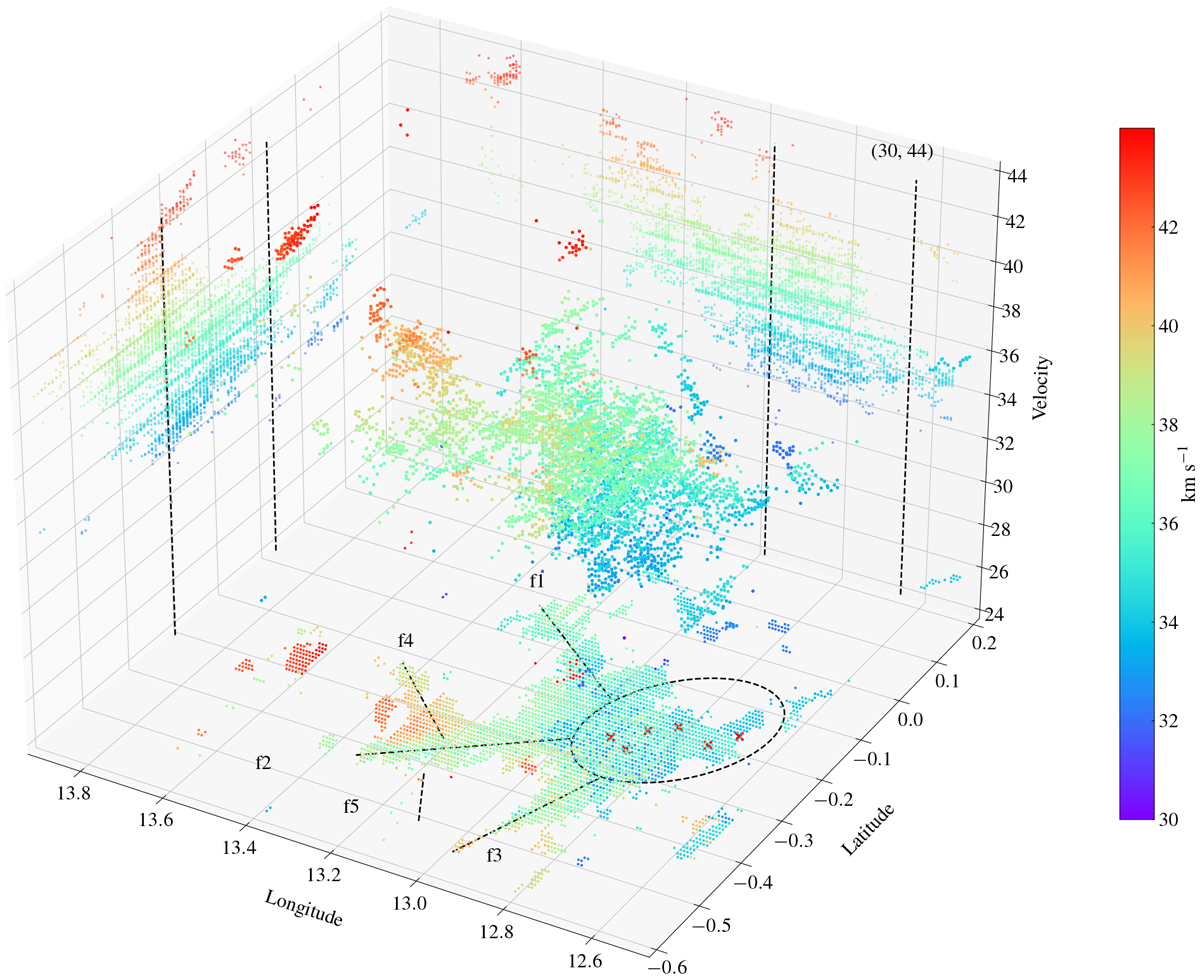
C18O (1–0) PPV space in the velocity interval of 30–44 km s−1. The projections on the three axes are presented. The colour of each point represents the centroid velocity at that point, corresponding to the colour bar shown to the right of the panel. The symbols ‘Xs’ are similar to those in Fig. 1, and the W33 complex is marked by the black dashed lines or the dashed ellipses on the three projections.
Current usage metrics show cumulative count of Article Views (full-text article views including HTML views, PDF and ePub downloads, according to the available data) and Abstracts Views on Vision4Press platform.
Data correspond to usage on the plateform after 2015. The current usage metrics is available 48-96 hours after online publication and is updated daily on week days.
Initial download of the metrics may take a while.