Fig. 3
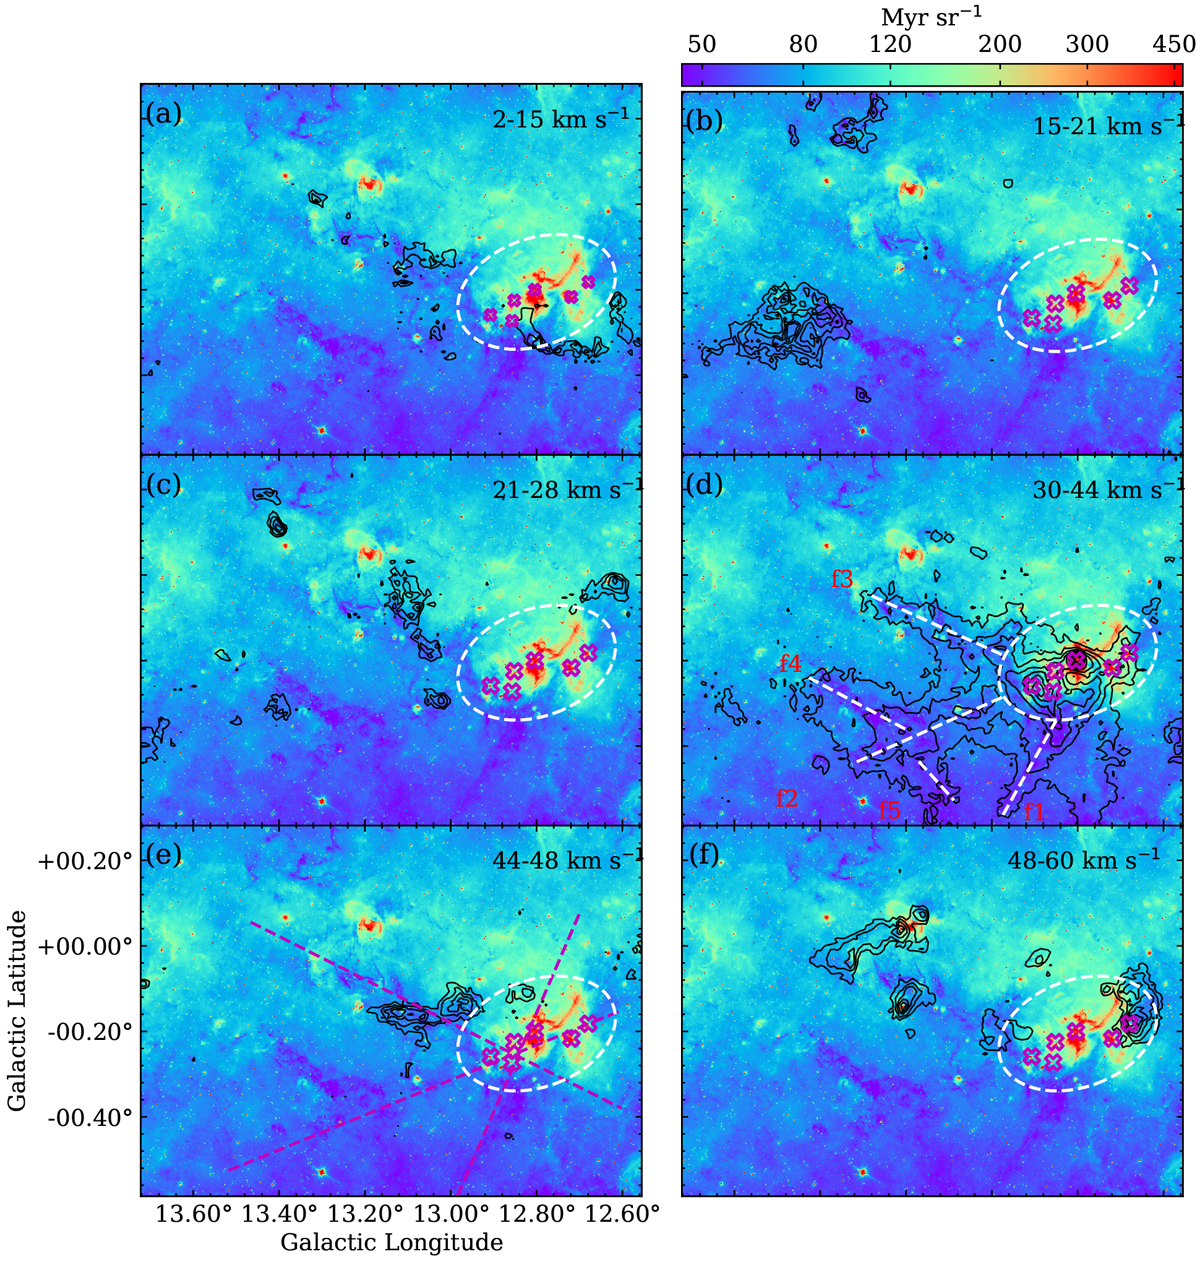
Panels a–f: velocity-integrated C18O (1–0) contours in the velocity ranges of 2–15 km s−1, 15–21 km s−1, 21–28 km s−1, 30–44 km s−1, 44–48 km s−1, and 48–60 km s−1 respectively, overlaid on the Spitzer 8 μm image. The white dashed lines in (d) show the filaments detected in 30–44 km s−1, and the magenta dashed lines in (e) represent the cutting directions of Fig. 10. The colour bar represents the flux at 8 μm in units of Myr sr−1.
Current usage metrics show cumulative count of Article Views (full-text article views including HTML views, PDF and ePub downloads, according to the available data) and Abstracts Views on Vision4Press platform.
Data correspond to usage on the plateform after 2015. The current usage metrics is available 48-96 hours after online publication and is updated daily on week days.
Initial download of the metrics may take a while.