Free Access
Fig. 11
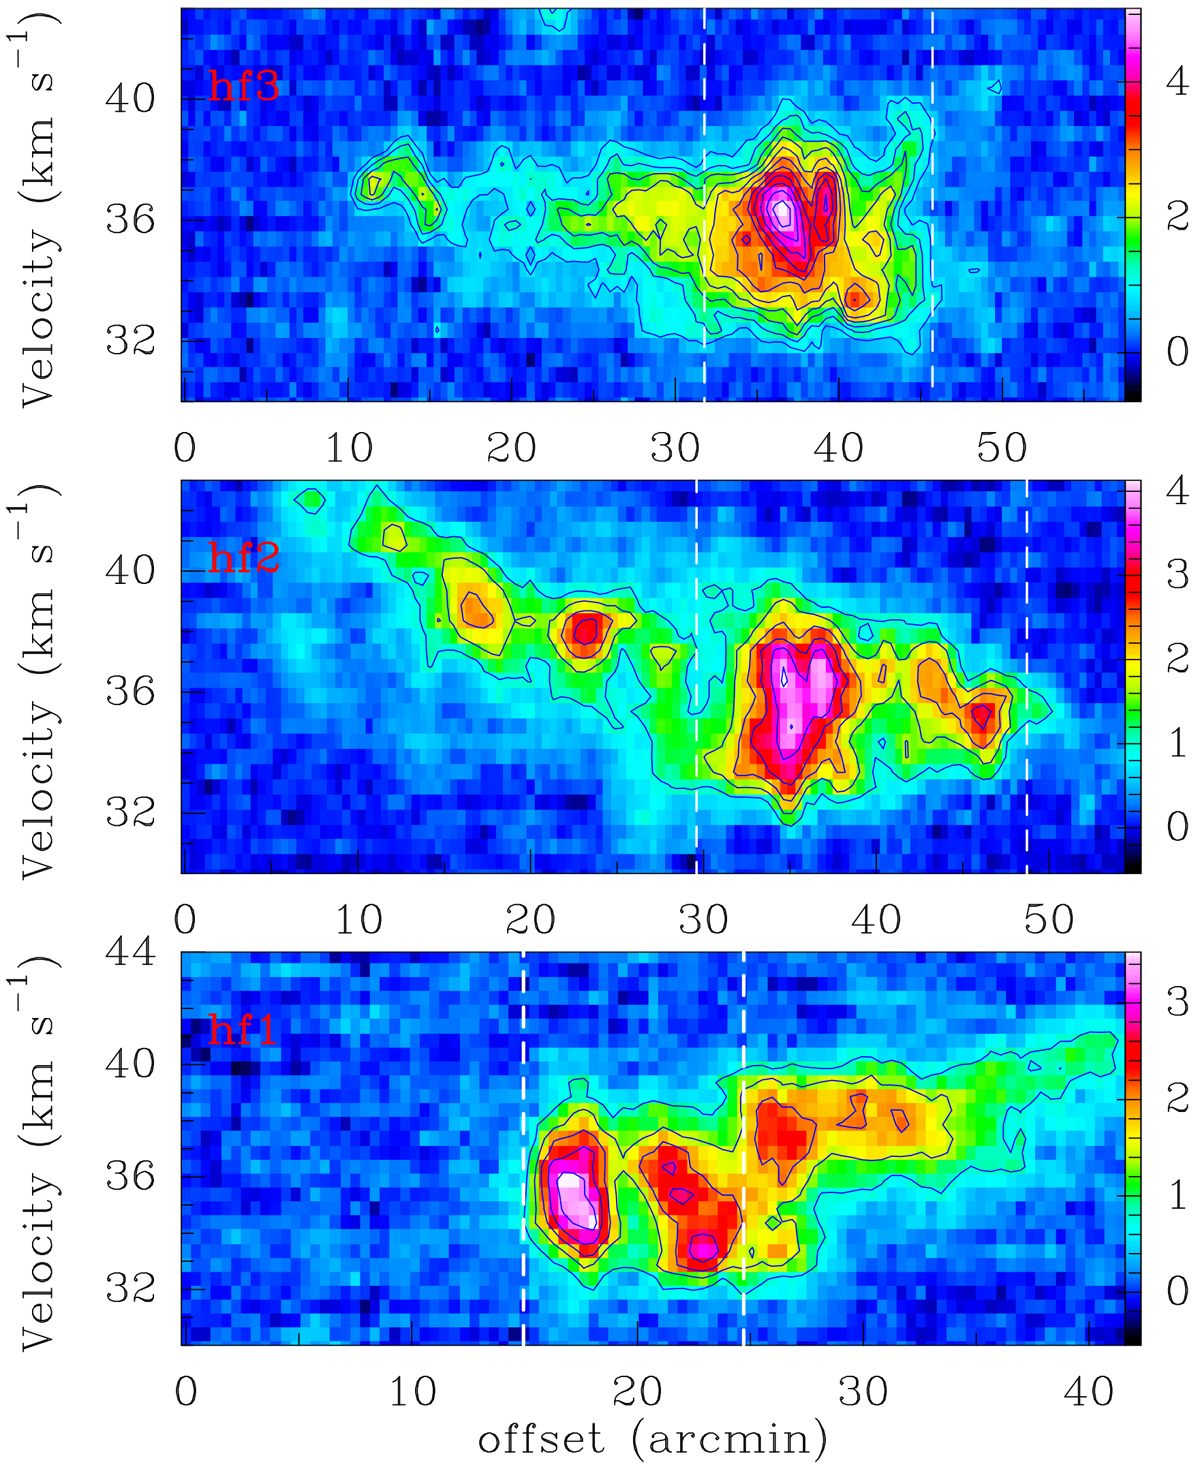
Position–velocity diagrams of C18O (1–0) along the cuts in Fig. 3e. The contour levels start from 5σ to the peak integrated intensity by 3σ (σ = 0.2 K). The vertical white dashed lines mark the location of the W33 complex, and the filaments detected are labelled in each panel.
Current usage metrics show cumulative count of Article Views (full-text article views including HTML views, PDF and ePub downloads, according to the available data) and Abstracts Views on Vision4Press platform.
Data correspond to usage on the plateform after 2015. The current usage metrics is available 48-96 hours after online publication and is updated daily on week days.
Initial download of the metrics may take a while.