Fig. 1
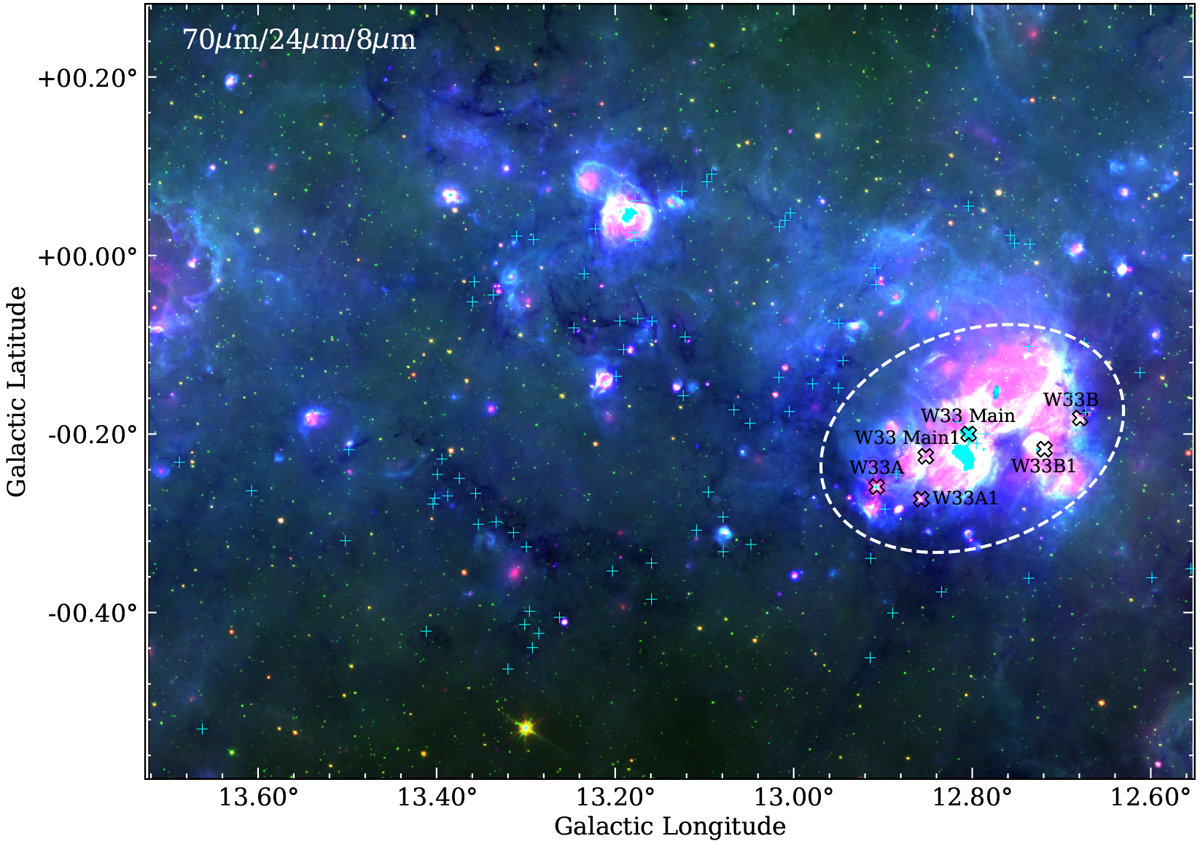
Three-olour composite image towards the W33 complex and its surroundings with blue, green, and red corresponding to Hi-GAL 70 μm (Pilbratt et al. 2010), GLIMPSE 8.0 μm (Benjamin et al. 2003), and MIPSGAL 24 μm (Carey et al. 2009), respectively. The ‘Xs’ symbols represent the massive clumps W33 Main, W33A, W33B, W33 Main1, W33A1, and W33B1 identified by Immer et al. (2014) with the ATLASGAL survey at 870 μm (Schuller et al. 2009). The plus symbols mark the locations of IRDCs identified by Peretto et al. (2016), and the white dashed ellipse represents the W33 complex.
Current usage metrics show cumulative count of Article Views (full-text article views including HTML views, PDF and ePub downloads, according to the available data) and Abstracts Views on Vision4Press platform.
Data correspond to usage on the plateform after 2015. The current usage metrics is available 48-96 hours after online publication and is updated daily on week days.
Initial download of the metrics may take a while.