| Issue |
A&A
Volume 645, January 2021
|
|
|---|---|---|
| Article Number | L9 | |
| Number of page(s) | 6 | |
| Section | Letters to the Editor | |
| DOI | https://doi.org/10.1051/0004-6361/202040031 | |
| Published online | 18 January 2021 | |
Letter to the Editor
A “no-drift” runaway pile-up of pebbles in protoplanetary disks in which midplane turbulence increases with radius
1
ISAS/JAXA, Sagamihara, Kanagawa, Japan
e-mail: This email address is being protected from spambots. You need JavaScript enabled to view it.
2
Earth-Life Science Institute, Tokyo Institute of Technology, Meguro-ku, Tokyo 152-8550, Japan
3
Laboratoire J.-L. Lagrange, Université Côte d’Azur, Observatoire de la Côte d’Azur, CNRS, 06304 Nice, France
Received:
1
December
2020
Accepted:
22
December
2020
Abstract
Context. A notable challenge of planet formation is to find a path to directly form planetesimals from small particles.
Aims. We aim to understand how drifting pebbles pile up in a protoplanetary disk with a nonuniform turbulence structure.
Methods. We consider a disk structure in which the midplane turbulence viscosity increases with the radius in protoplanetary disks, such as in the outer region of a dead zone. We perform 1D diffusion-advection simulations of pebbles that include back-reaction (the inertia) to the radial drift and the vertical and radial diffusions of pebbles for a given pebble-to-gas mass flux.
Results. We report a new mechanism, the “no-drift” runaway pile-up, that leads to a runaway accumulation of pebbles in disks, thus favoring the formation of planetesimals by streaming and/or gravitational instabilities. This occurs when pebbles drifting in from the outer disk and entering a dead zone experience a decrease in vertical turbulence. The scale height of the pebble subdisk then decreases, and, for small enough values of the turbulence in the dead zone and high values of the pebble-to-gas flux ratio, the back-reaction of pebbles on gas leads to a significant decrease in their drift velocity and thus their progressive accumulation. This occurs when the ratio of the flux of pebbles to that of the gas is large enough that the effect dominates over any Kelvin-Helmholtz shear instability. This process is independent of the existence of a pressure bump.
Key words: accretion, accretion disks / planets and satellites: formation / planet-disk interactions
© ESO 2021
1. Introduction
Forming planetesimals directly from small particles in an evolving protoplanetary disk is a major challenge in planet formation due to the “growth barrier” (Blum & Wurm 2000; Zsom et al. 2010) and the “drift barrier” (Whipple et al. 1972; Weidenschilling 1977). Streaming instability (SI) may be a promising mechanism for forming planetesimals directly from pebbles, although it requires special conditions: the Stokes number τs ≳ 0.01 and a local elevated solid-to-gas ratio (Z ≡ ρp/ρg ≳ 1, where ρp and ρg are the spatial densities of pebbles and gas, respectively; Youdin et al. 2004; Youdin & Goodman 2005; Carrera et al. 2015). How, when, and whether such conditions are met in an evolving protoplanetary disk are still a matter of intense debate.
Different mechanisms have been proposed for planetesimal formation via the local enhancement of materials. They include the diffusive redistribution and recondensation of water vapor outside the snow line (e.g., Stevenson & Lunine 1988; Ciesla & Cuzzi 2006; Ros & Johansen 2013), and detailed numerical simulations have been performed (e.g., Drżkowska & Alibert 2017; Schoonenberg & Ormel 2017; Hyodo et al. 2019, 2021; Gárate et al. 2020). Other mechanisms include pile-ups at pressure maxima. These pressure maxima can be created by the planet’s gravity (e.g., Dipierro & Laibe 2017; Kanagawa et al. 2018), by a sharp change in the local magneto-rotational instability- (MRI-) driven turbulence structure at an evaporation front (e.g., Kretke & Lin 2007; Brauer et al. 2008), by a change in the gas accretion velocity at the inner (e.g., Chatterjee & Tan 2014; Ueda et al. 2019; Charnoz et al. 2019) and outer (e.g., Pinilla et al. 2016) edges of a dead zone, and/or by the change in the gas profile due to gas-pebble friction (back-reaction) combined with pebble growth (Gonzalez et al. 2017). However, a positive pressure gradient may not be likely because the non-magnetohydrodynamic (non-MHD) effects erase a clear transition between dead and active zones (e.g., Mori et al. 2017). The back-reaction of solids onto the gas would smooth out the bump (e.g., Taki et al. 2016; Kanagawa et al. 2018). Further studies are required to assess these likelihoods in an evolving disk.
Over the last few decades, MHD simulations have shown that a region where ionization is too low for the MRI to operate (i.e., a “dead zone”; Gammie 1996) might ubiquitously exist in the inner part of the disk midplane, and that only surface layers are magnetically active, supporting accretion (Fig. 1; Gressel et al. 2015; Simon et al. 2015; Bai & Stone 2013; Bai et al. 2016; Mori et al. 2017). The transition between active and dead zones might be smooth (i.e., the α-parameter in the disk midplane αmid increases as a function of the distance to the star r), and αdead = 10−5 − 10−3 is reported for the α-parameter within a dead zone (e.g., Gressel et al. 2015; Simon et al. 2015; Mori et al. 2019). We note that the sound waves propagated from MRI-active surface layers (e.g., Okuzumi & Hirose 2011; Yang et al. 2018) and the vertical shear instability (VSI; e.g., Stoll & Kley 2016; Flock et al. 2020) could induce vertical mixing with an equivalent α for vertical diffusivity up to ∼10−3, even within a dead zone. These results imply nonuniform disk turbulence structures.
 |
Fig. 1. Schematic illustration of pebble drift and its pile-up within a protoplanetary disk with a dead zone. The disk gas accretion is characterized by α-parameter aacc, while the midplane diffusivity, being a dead zone (αdead ≪ αacc) in the inner region, is characterized by αmid. During the inward drift of pebbles, the pebble scale height Hp decreases as |

In this Letter, we consider a toy model of a protoplanetary disk with a dead zone located at the inner region of the disk. We consider different α-parameters for the gas accretion and for the pebble motion. Including the effects of the back-reaction of pebbles onto gas, which slows the drift velocity of pebbles, we study how drifting pebbles within a dead zone pile up. We demonstrate that a runaway pile-up of pebbles occurs for a sufficiently large pebble-to-gas mass flux Fp/g when pebbles reach a critical low-level of turbulence; we call this the “no-drift” (ND) runaway pile-up (the summary of this mechanism is shown by a schematic illustration in Fig. 1). It is worth mentioning that the newly reported ND mechanism does not require the snow line or the pressure maxima.
In Sect. 2, we describe the disk models and settings of our 1D simulations that solve the diffusion-advection of drifting pebbles. In Sect. 3, we show the results of our 1D simulations as well as analytical arguments. In Sect. 4, we summarize this Letter.
2. Models and settings
2.1. Gas structure
Here, we adopt a toy model where the gas accretion toward the central star is characterized by a non-dimensional α-parameter αacc (Fig. 1). Using the prescription of the classical α-accretion disk model (Shakura & Sunyaev 1973; Lynden-Bell & Pringle 1974), the surface density of the gas is given as
 (1)
(1)
where Ṁg and  are the gas mass accretion rate and the effective viscosity, respectively (cs is the gas sound velocity and ΩK is the Keplerian orbital frequency).
The gas rotates at sub-Keplerian speed. The degree of the deviation of the gas rotation frequency from that of Keplerian η is given by
 (2)
(2)
where Ω, Pg, and Hg are the gas orbital frequency, the gas pressure, and the gas scale height, respectively, and Cη is defined as
 (3)
(3)
which depends on the temperature profile (e.g., Cη = 11/8 for T ∝ r−1/2).
Using the α-disk prescription, the gas accretion velocity vg is written as
 (4)
(4)
 (5)
(5)
where a negative sign indicates accretion toward the central star.
2.2. Pebbles in the disk midplane
The radial drift velocity of pebbles, including the effects of gas-solid friction − drift back-reaction (hereafter Drift-BKR) − is given as (Ida & Guillot 2016; Schoonenberg & Ormel 2017; Hyodo et al. 2019)
 (6)
(6)
where τs is the Stokes number of pebbles. Λ ≡ ρg/(ρg + ρp) = 1/(1 + Z) characterizes the strength of the back-reaction due to the pile-up of pebbles, where Z ≡ ρp/ρg is the midplane pebble-to-gas density ratio ( and
and  , where Σp and Hp are the surface density and scale height of pebbles, respectively).
The disk midplane could be too weakly ionized for the MRI to operate (the dead zone with extremely weak turbulence; Gammie 1996). Thus, the disk midplane could have very different turbulence from that of gas accretion, which controls the disk surface density (i.e., αacc). In this Letter, we use an effective viscous parameter αmid to characterize the radial and vertical diffusion processes of pebbles near the disk midplane (Fig. 1).
The scale height of pebbles characterizes the degree of pebble concentration in the disk midplane ( ). In the steady state, the scale height of pebbles is regulated by the vertical turbulent stirring (Dubrulle et al. 1995; Youdin & Lithwick 2007; Okuzumi et al. 2012; Hyodo et al. 2019) as
 (7)
(7)
where a coefficient K characterizes the strength of the back-reaction onto the diffusivity (Hyodo et al. 2019; Ida et al. 2021) and K = 1 is used (the choice of the K value does not alter the conclusion – see Appendix A for the K = 0 case).
For a small αmid (i.e., for a small Hp, tur), a vertical shear Kelvin-Helmholtz (KH) instability prevents a further decrease in the pebble scale height. This minimum scale height, Hp, KH, is (Hyodo et al. 2021)
 (8)
(8)
which is valid for Z ≲ 1, and Z ≫ 1 indicates a gravitational collapse. Thus, the scale height of pebbles Hp is given as
 (9)
(9)
2.3. Numerical settings
We performed 1D diffusion-advection simulations that included the back-reaction (the inertia) to radial drift of pebbles that slows the pebble drift velocity as pile-up proceeds (see details in Hyodo et al. 2019, 2021). The drift velocity of pebbles is given by Eq. (6), while the diffusivity is given as  . We included back-reaction onto the diffusivity of pebbles (with K = 1). We assumed that pebbles drift outside the snow line, and the sublimation of pebbles was neglected (i.e., the dead zone exists beyond the snow line). The Stokes number of pebbles was set to be constant: τs = 0.1 (Okuzumi et al. 2016; Ida & Guillot 2016). The disk midplane temperature was set to T(r) = 150 K × (r/3 au)−β (β = 1/2). The surface density of the gas (molecular weight of μg = 2.34) is described by Σg = Ṁg/3πνg, where
  . We used αacc = 10−2 and Ṁg = 10−8 M⊙ yr−1. These led to Cη = 11/8 for Σg ∝ r−1 and T ∝ r−1/2.
We considered a dead zone in the inner region of the disk midplane, and we used a non-dimensional turbulence parameter in the midplane αmid, which differs from the one that characterizes gas accretion, αacc (Eq. (1)). The midplane αmid is modeled as
![Mathematical equation: $$ \begin{aligned} \alpha _{\rm mid}(r) = \alpha _{\rm dead} + \left( \frac{\alpha _{\rm acc} - \alpha _{\rm dead}}{2} \right) \left[ \mathrm{erf} \left( 3 + \frac{6\left( r - r^{*} \right) }{\Delta r_{\rm tra}} \right) + 1 \right], \end{aligned} $$](/articles/aa/full_html/2021/01/aa40031-20/aa40031-20-eq17.gif) (10)
(10)
where: αacc and αdead are those outside and inside a dead zone; r* is the innermost radial distance, where αmid = αacc; and Δrtra is the radial width of the transition from αmid = αacc to αmid = αdead. As shown below, the ND mode occurs for an arbitrary choice of the dead zone structure, that is, irrespective of a sharp or a smooth change between the active and dead zones (i.e., an arbitrary choice of αdead, αacc, r*, and Δrtra), as long as it satisfies that αmid is smaller than a threshold value (Sect. 3.2.2).
At the beginning of the 1D simulations, we set the pebble-to-gas mass flux Fp/g at the outer boundary (rout = 15 au), and Fp/g at rout was fixed throughout the simulations. We note that Elbakyan et al. (2020) performed a time-dependent simulation of disk formation to find a high Fp/g variation between 𝒪(10−4) to 𝒪(1) in a single disk evolution (see also Ida et al. 2021).
3. Results
3.1. Numerical results
Figure 2 shows the results of our 1D simulations for different combinations of Fp/g and the midplane turbulence structures (i.e., different choices of αdead, r*, and Δrtra in Eq. (10)) for the case of αacc = 10−2. The top panels show given turbulence structures (i.e., αmid(r)/αacc) and the bottom panels show the resultant midplane pebble-to-gas ratio in their spatial densities (i.e., ρp/ρg). The gray lines in the top panels are the analytically derived critical αmid/αacc below which a runaway pile-up of pebbles is expected to occur for a given Fp/g (Eq. (23) with τs = 0.1).
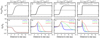 |
Fig. 2. αmid/αacc (top panels) and Z = ρp/ρg (bottom panels) as a function of the distance to a star in the 1D numerical simulations. Included are the cases where αacc = 10−2 and τp = 0.1. From left to right: cases where (Fp/g, αdead, r*, Δrtra) = (0.11, 10−4, 9 au, 5 au), (0.17, 10−4, 9 au, 5 au), (0.47, 10−4, 9 au, 5 au), and (0.17, 10−4, 5 au, 0.5 au). The gray lines in the top panels represent the analytical critical αmid/αacc below which the ND runaway pile-up is expected to occur for a given Fp/g (Eq. (23) with Fp/g > Fp/g, crit2). The gray lines in the bottom panels show the critical Z (i.e., Zcrit = 1) above which the ND runaway pile-up occurs (Sect. 3.2). The blue, green, and red lines in the bottom panels are those at t = 3 × 10⁴ yrs, t = 1 × 10⁵ yrs, and t = 3 × 10⁵ yrs from the beginning of the calculations, respectively. Panel a: system that reaches a steady-state, panels b–d: ND runaway pile-ups. |
For a small Fp/g (e.g., Fp/g = 0.11; panel a in Fig. 2), the system reaches a steady state. For this given Fp/g, analytical arguments (the gray line) predict the requirement of a smaller αmid/αacc for a runaway pile-up of pebbles to occur (i.e., the black line in Fig. 2 needs to be below the gray line).
For a larger Fp/g (e.g., Fp/g = 0.17; panel b in Fig. 2) that has the same αmid/αacc structure as that of panel a, pebbles progressively pile up over time. Continuous pile-up occurs as the drift velocity of pebbles progressively decreases due to strong Drift-BKR and as the pile-up efficiently proceeds. For the Fp/g given here, the gray line overlaps with the black line (i.e., the analytical requirement for the runaway pile-up is met) and the analytical arguments (Sect. 3.2) show a very good accordance with 1D numerical simulations. For an even larger Fp/g with the same αmid(r)/αacc as those in panels a and b, a runaway pile-up of pebbles occurs more quickly and significantly (panel c in Fig. 2).
Comparing panels b and d in Fig. 2 (the same Fp/g, αdead, and αacc but different shapes and locations of the transition between active and dead zones), 1D simulations demonstrate that a runaway pile-up of pebbles occurs irrespective of the shape and location of the dead zone as long as Fp/g is sufficiently large. This shows the robustness of this new mechanism of runaway pebble pile-up.
Numerical results show that when the change in the midplane turbulence on r is smooth (i.e., αmid), the pile-up of pebbles efficiently propagates toward the outer region in the disk (compare panels b and d in Fig. 2). This indicates that, when the ND runaway pile-up occurs at a given radial distance, a progressive pile-up of pebbles could occur even at a greater radial distance where the ND conditions are not met, leading to a global pile-up of pebbles for the SI to operate.
When αacc = 10−3, 1D simulations only show a runaway pile-up of pebbles for a very large value of Fp/g (Fp/g ≳ 0.8). This is because the surface density of the gas increases (Eq. (1)) for a smaller αacc, and ρp/ρg correspondingly decreases.
3.2. Analytical arguments
3.2.1. Midplane concentration of pebbles
Below, we discuss the concentration of pebbles in the disk midplane considering Drift-BKR. Our arguments are made using the analytical equation presented below (Eq. (11)). We solve this equation using two distinct approaches: a direct numerical approach and an analytical approach with some approximation. In both ways, we identify a parameter space (Fp/g − αacc − αmid space) where the ND runaway pile-up of drifting pebbles could take place.
The concentration of pebbles at the midplane is written as
 (11)
(11)
where hp/g ≡ Hp/Hg and vp are functions of Λ(Z). We directly find a solution (i.e., solve for Z) for Eq. (11) for a given Fp/g and αmid. The color contours in Fig. 3 show directly obtained ρp/ρg and the red region is where no steady-state solution is found (i.e., the radial drift of pebbles is halted due to Drift-BKR). The dashed lines in Fig. 3 are analytically derived critical Fp/g, crit, above which no steady-state solution is found for ρp/ρg (i.e., the ND runaway pile-up). The analytical estimations reproduce the direct solutions well.
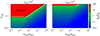 |
Fig. 3. Midplane pebble-to-gas ratio Z ≡ ρp/ρg in the αmid/αacc − Fp/g space. Included are the cases where r = 5 au, Cη = 11/8 for T ∝ r−1/2, τs = 0.1, and Ri = 0.5. Left and right panels: cases where αacc = 10−2 and αacc = 10−3, respectively. The color contours are obtained by directly solving Eq. (11). The red regions indicate the no-drift runaway pile-up. The diagonal dashed black line (Eq. (16)) and the horizontal dashed black line (Eq. (20)) are the analytically derived critical Fp/g, crit above which the ND runaway pile-up takes place. The critical Z above which the ND runaway pile-up occurs (i.e., Zcrit = 1) is shown by the white lines. The parameter map is very weakly dependent on the radial distance to the star (see Eqs. (16) and (20)), and the ND mode can occur irrespective of the shape and position of a dead zone. |
The Fp/g, crit can be divided into two different regimes. In the first regime, Hp, tur > Hp, KH, max, where Hp, KH, max is the maximum scale height of pebbles regulated by a KH instability. In this case, using Eqs. (5) and (6), the vertically averaged metallicity of pebbles is given as
 (12)
(12)
 (13)
(13)
 (14)
(14)
where an approximation is made for αacc ≪ τs ≪ 1, Z ≪ 1, Λ ≃ 1. Solving this equation gives
 (15)
(15)
where  and
and  . The ZΣ has a real solution when 1−4ab > 0 and a critical Fp/g, crit1 for the first regime is given as
 (16)
(16)
![Mathematical equation: $$ \begin{aligned}&\simeq 0.15 \times \left( \frac{\alpha _{\rm acc}}{10^{-2}}\right)^{-1} \left( \frac{\alpha _{\rm mid}}{10^{-4}} \right)^{1/2} \left( \frac{\tau _{\rm s}}{0.1} \right)^{1/2} \left( \frac{C_{\rm \eta }}{11/8} \right) \\& \left[ \mathrm{for \,} H_{\rm p,tur} > H_{\rm p,KH,max} \right] , \nonumber \end{aligned} $$](/articles/aa/full_html/2021/01/aa40031-20/aa40031-20-eq26.gif) (17)
(17)
where hp/g ≃ (τs/(αmid(1+Z)−K))−1/2 ≃ (τs/αmid)−1/2 for Z ≪ 1 and αmid ≪ 1 + τs (Eq. (9)). The above criteria for Fp/g, crit1 are independent of r, and thus the ND mechanism occurs irrespective of the position and shape of a dead zone as long as it satisfies its criteria (i.e., Eq. (16)). The diagonal dashed black line in Fig. 3 shows Eq. (16) and is in accordance with the direct solutions of Eq. (11) (color contours in Fig. 3). The critical Z above which the ND occurs, Zcrit, is obtained by inserting Eq. (16) into Eq. (11), and Zcrit ∼ 1 for the first regime. Analytical Zcrit = 1 agrees with the direct solution (color contours in Fig. 3). We note that because Fp/g, crit1 is proportional to Cη, it increases with a steeper Σg gradient at an outer boundary of a dead zone. However, the ND mode does not need a sharp boundary. If the boundary is very gradual, the change in Cη is negligible.
The second regime appears when a KH instability plays a role, which corresponds to Hp, tur < Hp, KH, max. Thus, in this case, the scale height of pebbles is described by Hp, KH, which is independent of αmid. As ρp/ρg increases from zero, Hp, KH initially increases and reaches its maximum Hp, KH, max at Z = ρp/ρg = 1/2. As ρp/ρg further increases, Hp, KH decreases1. By smoothly connecting with the critical value of Zcrit = 1 in the first regime (i.e., Zcrit = 1 as well in the second regime, which agrees with the direct solution; see the color contours in Fig. 3), the critical Fp/g in the second regime Fp/g, crit2 adopts  (Hp, KH with Z = 1), and Zcrit is given as
 (18)
(18)
 (19)
(19)
where  and an approximation is made for αacc ≪ τs ≪ 1 and Λ ≃ 1. The
  is Λ using
  . Here, Z = 1 and
  . Thus, Fp/g, crit2 with Cη = 11/8 is given as
 (20)
(20)
![Mathematical equation: $$ \begin{aligned}&\simeq 0.06 \times \left( \frac{\alpha _{\rm acc}}{10^{-2}}\right)^{-1} \left( \frac{\tau _{\rm s}}{0.1}\right) \left( \frac{Ri}{0.5}\right)^{1/2} \left( \frac{H_{\rm g}/r}{0.04} \right) , \\& \left[ \mathrm{for \,} H_{\rm p,tur} < H_{\rm p,KH,max} \right] \nonumber \end{aligned} $$](/articles/aa/full_html/2021/01/aa40031-20/aa40031-20-eq35.gif) (21)
(21)
which is independent of αmid. We note that the above criterion for Fp/g, crit2 has a very weak dependence on r through Hg/r. Equation (20) is plotted by a horizontal dashed black line in Fig. 3, and it shows a good consistency with the direct solution of Eq. (11). Including a KH instability (i.e., the second regime and Eq. (20)) prevents the scale height of pebbles from becoming increasingly smaller as αmid decreases, reducing the parameter range of the ND runaway pile-up2.
3.2.2. Criteria for the ND runaway pile-up
Summarizing the analytical arguments above, the scale height of pebbles decreases with decreasing αmid until a KH instability plays a role. As pebbles drift inward from the active to the dead zones in the disk midplane, αmid becomes smaller with decreasing distance to the star r, while keeping a constant Fp/g. This implies that the evolutionary path in the αmid/αacc − Fp/g space (Fig. 3) is a horizontal shift from right to left for a given fixed Fp/g as pebbles drift inward. Therefore, for the ND mode to take place, the following two conditions need to be met.
First, Fp/g needs to be sufficiently large to satisfy Fp/g ≥ Fp/g, crit2. As Fp/g, crit2 ∝ 1/αacc (Eq. (20)), the ND mode is limited to relatively large Fp/g values for the αacc = 10−3 case (Fp/g ≳ 0.8 at 5 au), while only moderate Fp/g ≳ 0.08 is required in the case of αacc = 10−2.
Second, a sufficiently small αmid/αacc is required in order to have a sufficiently small scale height of pebbles. Rewriting Eq. (16) gives a critical αmid/αacc below which the ND occurs for a given Fp/g as
 (22)
(22)
 (23)
(23)
which is independent of r. These two criteria are in very good accordance with the 1D simulations (Sect. 3.1).
4. Conclusions
In this Letter, we studied how drifting pebbles pile up in a protoplanetary disk with a nonuniform turbulence structure, including the back-reaction of pebbles onto the gas that slows the drift velocity of pebbles as pile-up proceeds. We considered that gas accretion is regulated by an α-parameter that is distinct from that of midplane turbulence. In the disk midplane, the turbulence strength can decrease with decreasing radial distance (e.g., the case where the inner region of the disk is an MRI-inactive dead-zone and the outer region is MRI-active). Thus, drifting pebbles are further concentrated in the midplane as the scale height decreases.
We demonstrated a new mechanism for a runaway pile-up of pebbles to occur for a moderate Fp/g when pebbles reach a critical level of low turbulence in the dead zone via a continuous slowing of their drift velocity due to the back-reaction (the “no-drift” (ND) runaway pile-up). The ND runaway pile-up occurs irrespective of the shape of the dead zone. Our results imply that SI could also occur as a natural consequence of pebble drift in a protoplanetary disk with a dead zone.
The minimum scale height of pebbles in a dead zone is a critical parameter that characterizes the ND mode. Further studies that include detailed physical processes – such as a KH instability, VSI, vertical shear streaming instability, and the velocity fluctuation by the sound waves propagated from MRI-active surface layers – are required.
We note that Hp, KH is a mean square root of the vertical height of particles but not the truncated height of the distribution.
The vertical shear streaming instability (VSSI; Lin 2020) might affect the pebble scale height when the midplane diffusivity is very small. If the VSSI dominated over a KH instability for the scale height of pebbles, the boundary of the ND regime would be regulated by the VSSI.
Acknowledgments
We thank Satoshi Okuzumi and Shoji Mori for helpful comments and fruitful discussion. R.H. acknowledges the financial support of JSPS Grants-in-Aid (JP17J01269, 18K13600). R.H. also acknowledges JAXA’s International Top Young program. S.I. acknowledges the financial support (JSPS Kakenhi 15H02065, MEXT Kakenhi 18H05438). T.G. was partially supported by a JSPS Long Term Fellowship at the University of Tokyo.
References
- Bai, X.-N., & Stone, J. M. 2013, ApJ, 769, 76 [NASA ADS] [CrossRef] [Google Scholar]
- Bai, X.-N., Ye, J., Goodman, J., & Yuan, F. 2016, ApJ, 818, 152 [Google Scholar]
- Blum, J., & Wurm, G. 2000, Icarus, 143, 138 [NASA ADS] [CrossRef] [Google Scholar]
- Brauer, F., Henning, T., & Dullemond, C. P. 2008, A&A, 487, L1 [NASA ADS] [CrossRef] [EDP Sciences] [Google Scholar]
- Carrera, D., Johansen, A., & Davies, M. B. 2015, A&A, 579, A43 [NASA ADS] [CrossRef] [EDP Sciences] [Google Scholar]
- Charnoz, S., Pignatale, F. C., Hyodo, R., et al. 2019, A&A, 627, A50 [NASA ADS] [CrossRef] [EDP Sciences] [Google Scholar]
- Chatterjee, S., & Tan, J. C. 2014, ApJ, 780, 53 [NASA ADS] [CrossRef] [Google Scholar]
- Ciesla, F. J., & Cuzzi, J. N. 2006, Icarus, 181, 178 [NASA ADS] [CrossRef] [Google Scholar]
- Dipierro, G., & Laibe, G. 2017, MNRAS, 469, 1932 [NASA ADS] [CrossRef] [Google Scholar]
- Drżkowska, J., & Alibert, Y. 2017, A&A, 608, A92 [NASA ADS] [CrossRef] [EDP Sciences] [Google Scholar]
- Dubrulle, B., Morfill, G., & Sterzik, M. 1995, Icarus, 114, 237 [NASA ADS] [CrossRef] [Google Scholar]
- Elbakyan, V. G., Johansen, A., Lambrechts, M., Akimkin, V., & Vorobyov, E. I. 2020, A&A, 637, A5 [CrossRef] [EDP Sciences] [Google Scholar]
- Flock, M., Turner, N. J., Nelson, R. P., et al. 2020, ApJ, 897, 155 [CrossRef] [Google Scholar]
- Gammie, C. F. 1996, ApJ, 457, 355 [NASA ADS] [CrossRef] [Google Scholar]
- Gárate, M., Birnstiel, T., Drążkowska, J., & Stammler, S. M. 2020, A&A, 635, A149 [NASA ADS] [CrossRef] [EDP Sciences] [Google Scholar]
- Gonzalez, J. F., Laibe, G., & Maddison, S. T. 2017, MNRAS, 467, 1984 [NASA ADS] [Google Scholar]
- Gressel, O., Turner, N. J., Nelson, R. P., & McNally, C. P. 2015, ApJ, 801, 84 [NASA ADS] [CrossRef] [Google Scholar]
- Hyodo, R., Ida, S., & Charnoz, S. 2019, A&A, 629, A90 [NASA ADS] [CrossRef] [EDP Sciences] [Google Scholar]
- Hyodo, R., Guillot, T., Ida, S., Okuzumi, S., & Youdin, A. N. 2021, A&A, in press, https://doi.org/10.1051/0004-6361/202039894 [Google Scholar]
- Ida, S., & Guillot, T. 2016, A&A, 596, L3 [Google Scholar]
- Ida, S., Guillot, T., Hyodo, R., Okuzumi, S., & Youdin, A. N. 2021, A&A, in press, https://doi.org/10.1051/0004-6361/202039705 [Google Scholar]
- Kanagawa, K. D., Muto, T., Okuzumi, S., et al. 2018, ApJ, 868, 48 [NASA ADS] [CrossRef] [Google Scholar]
- Kretke, K. A., & Lin, D. N. C. 2007, ApJ, 664, L55 [NASA ADS] [CrossRef] [Google Scholar]
- Lin, M. K. 2020, ApJ, accepted [arXiv:2011.12300] [Google Scholar]
- Lynden-Bell, D., & Pringle, J. E. 1974, MNRAS, 168, 603 [NASA ADS] [CrossRef] [Google Scholar]
- Mori, S., Muranushi, T., Okuzumi, S., & Inutsuka, S.-I. 2017, ApJ, 849, 86 [NASA ADS] [CrossRef] [Google Scholar]
- Mori, S., Bai, X.-N., & Okuzumi, S. 2019, ApJ, 872, 98 [NASA ADS] [CrossRef] [Google Scholar]
- Okuzumi, S., & Hirose, S. 2011, ApJ, 742, 65 [NASA ADS] [CrossRef] [Google Scholar]
- Okuzumi, S., Tanaka, H., Kobayashi, H., & Wada, K. 2012, ApJ, 752, 106 [NASA ADS] [CrossRef] [Google Scholar]
- Okuzumi, S., Momose, M., Sirono, S.-I., Kobayashi, H., & Tanaka, H. 2016, ApJ, 821, 82 [NASA ADS] [CrossRef] [Google Scholar]
- Pinilla, P., Flock, M., Ovelar, M. d. J., & Birnstiel, T. 2016, A&A, 596, A81 [NASA ADS] [CrossRef] [EDP Sciences] [Google Scholar]
- Ros, K., & Johansen, A. 2013, A&A, 552, A137 [NASA ADS] [CrossRef] [EDP Sciences] [Google Scholar]
- Schoonenberg, D., & Ormel, C. W. 2017, A&A, 602, A21 [NASA ADS] [CrossRef] [EDP Sciences] [Google Scholar]
- Shakura, N. I., & Sunyaev, R. A. 1973, A&A, 24, 337 [NASA ADS] [Google Scholar]
- Simon, J. B., Lesur, G., Kunz, M. W., & Armitage, P. J. 2015, MNRAS, 454, 1117 [NASA ADS] [CrossRef] [Google Scholar]
- Stevenson, D. J., & Lunine, J. I. 1988, Icarus, 75, 146 [NASA ADS] [CrossRef] [Google Scholar]
- Stoll, M. H. R., & Kley, W. 2016, A&A, 594, A57 [NASA ADS] [CrossRef] [EDP Sciences] [Google Scholar]
- Taki, T., Fujimoto, M., & Ida, S. 2016, A&A, 591, A86 [NASA ADS] [CrossRef] [EDP Sciences] [Google Scholar]
- Ueda, T., Flock, M., & Okuzumi, S. 2019, ApJ, 871, 10 [NASA ADS] [CrossRef] [Google Scholar]
- Weidenschilling, S. J. 1977, MNRAS, 180, 57 [Google Scholar]
- Whipple, F. L. 1972, in From Plasma to Planet, ed. A. Elvius, 211 [Google Scholar]
- Yang, C.-C., Mac Low, M.-M., & Johansen, A. 2018, ApJ, 868, 27 [NASA ADS] [CrossRef] [Google Scholar]
- Youdin, A. N., & Goodman, J. 2005, ApJ, 620, 459 [NASA ADS] [CrossRef] [Google Scholar]
- Youdin, A. N., & Lithwick, Y. 2007, Icarus, 192, 588 [NASA ADS] [CrossRef] [Google Scholar]
- Youdin, A. N., & Shu, F. H. 2004, in Planetary Systems in the Universe, ed. A. Penny, IAU Symp., 202, 250 [Google Scholar]
- Zsom, A., Ormel, C. W., Güttler, C., Blum, J., & Dullemond, C. P. 2010, A&A, 513, A57 [NASA ADS] [CrossRef] [EDP Sciences] [Google Scholar]
Appendix A: The case of K = 0
Here, we show the case of K = 0, where the diffusivity of pebbles is a fixed constant:  (i.e., the back-reaction onto the diffusivity is neglected). Figure A.1 is the same as Fig. 2 but for the case of K = 0.
As seen in the case of K = 1 (Fig. 2), a runaway pile-up of pebbles within a dead zone occurs as long as Fp/g meets the conditions discussed in Sect. 3.2.2 (the analytical arguments were made for K = 0). Compared to the case of K = 1, the radial width and the timescale of the pile-up are in general narrower and longer in the case of K = 0 because the diffusivity is a constant for K = 0, while it becomes smaller for K = 1 as pile-up proceeds. These additional simulations with K = 0 further show the robustness of the physical mechanism presented in this Letter and demonstrate that Drift-BKR, which slows the drift velocity of pebbles, is a fundamental ingredient for the ND mechanism.
All Figures
|
Fig. 1. Schematic illustration of pebble drift and its pile-up within a protoplanetary disk with a dead zone. The disk gas accretion is characterized by α-parameter aacc, while the midplane diffusivity, being a dead zone (αdead ≪ αacc) in the inner region, is characterized by αmid. During the inward drift of pebbles, the pebble scale height Hp decreases as |
| In the text | |
|
Fig. 2. αmid/αacc (top panels) and Z = ρp/ρg (bottom panels) as a function of the distance to a star in the 1D numerical simulations. Included are the cases where αacc = 10−2 and τp = 0.1. From left to right: cases where (Fp/g, αdead, r*, Δrtra) = (0.11, 10−4, 9 au, 5 au), (0.17, 10−4, 9 au, 5 au), (0.47, 10−4, 9 au, 5 au), and (0.17, 10−4, 5 au, 0.5 au). The gray lines in the top panels represent the analytical critical αmid/αacc below which the ND runaway pile-up is expected to occur for a given Fp/g (Eq. (23) with Fp/g > Fp/g, crit2). The gray lines in the bottom panels show the critical Z (i.e., Zcrit = 1) above which the ND runaway pile-up occurs (Sect. 3.2). The blue, green, and red lines in the bottom panels are those at t = 3 × 10⁴ yrs, t = 1 × 10⁵ yrs, and t = 3 × 10⁵ yrs from the beginning of the calculations, respectively. Panel a: system that reaches a steady-state, panels b–d: ND runaway pile-ups. |
| In the text | |
|
Fig. 3. Midplane pebble-to-gas ratio Z ≡ ρp/ρg in the αmid/αacc − Fp/g space. Included are the cases where r = 5 au, Cη = 11/8 for T ∝ r−1/2, τs = 0.1, and Ri = 0.5. Left and right panels: cases where αacc = 10−2 and αacc = 10−3, respectively. The color contours are obtained by directly solving Eq. (11). The red regions indicate the no-drift runaway pile-up. The diagonal dashed black line (Eq. (16)) and the horizontal dashed black line (Eq. (20)) are the analytically derived critical Fp/g, crit above which the ND runaway pile-up takes place. The critical Z above which the ND runaway pile-up occurs (i.e., Zcrit = 1) is shown by the white lines. The parameter map is very weakly dependent on the radial distance to the star (see Eqs. (16) and (20)), and the ND mode can occur irrespective of the shape and position of a dead zone. |
| In the text | |
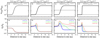 |
Fig. A.1. Same as Fig. 2 but for the case of K = 0. |
| In the text | |
Current usage metrics show cumulative count of Article Views (full-text article views including HTML views, PDF and ePub downloads, according to the available data) and Abstracts Views on Vision4Press platform.
Data correspond to usage on the plateform after 2015. The current usage metrics is available 48-96 hours after online publication and is updated daily on week days.
Initial download of the metrics may take a while.