Fig. 2.
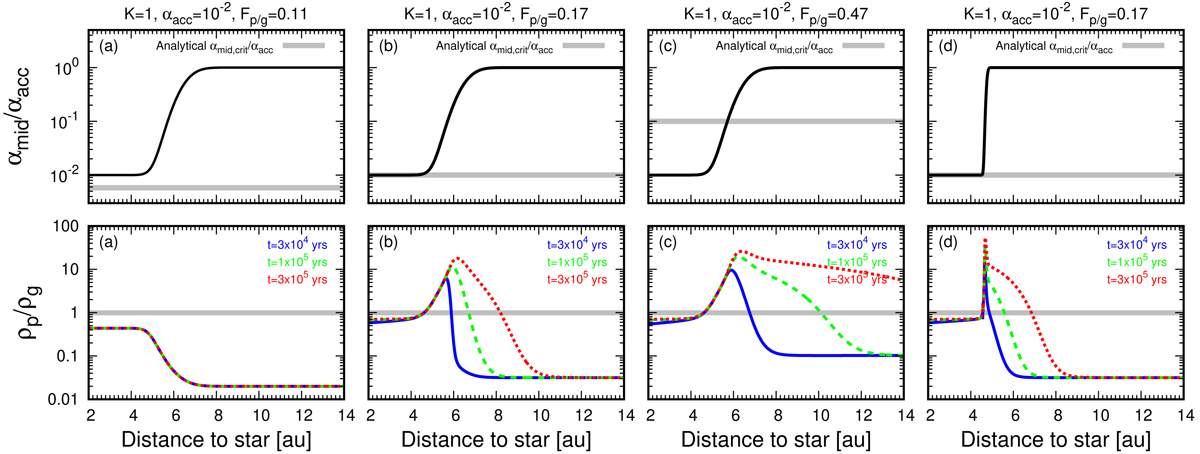
αmid/αacc (top panels) and Z = ρp/ρg (bottom panels) as a function of the distance to a star in the 1D numerical simulations. Included are the cases where αacc = 10−2 and τp = 0.1. From left to right: cases where (Fp/g, αdead, r*, Δrtra) = (0.11, 10−4, 9 au, 5 au), (0.17, 10−4, 9 au, 5 au), (0.47, 10−4, 9 au, 5 au), and (0.17, 10−4, 5 au, 0.5 au). The gray lines in the top panels represent the analytical critical αmid/αacc below which the ND runaway pile-up is expected to occur for a given Fp/g (Eq. (23) with Fp/g > Fp/g, crit2). The gray lines in the bottom panels show the critical Z (i.e., Zcrit = 1) above which the ND runaway pile-up occurs (Sect. 3.2). The blue, green, and red lines in the bottom panels are those at t = 3 × 10⁴ yrs, t = 1 × 10⁵ yrs, and t = 3 × 10⁵ yrs from the beginning of the calculations, respectively. Panel a: system that reaches a steady-state, panels b–d: ND runaway pile-ups.
Current usage metrics show cumulative count of Article Views (full-text article views including HTML views, PDF and ePub downloads, according to the available data) and Abstracts Views on Vision4Press platform.
Data correspond to usage on the plateform after 2015. The current usage metrics is available 48-96 hours after online publication and is updated daily on week days.
Initial download of the metrics may take a while.