Fig. 1.
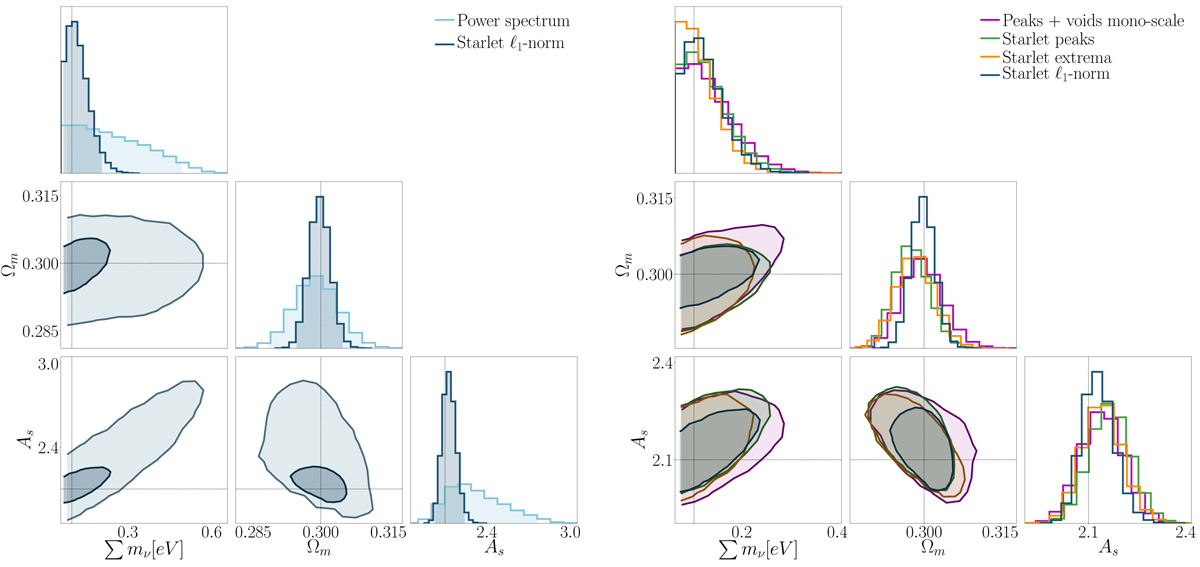
95% confidence contour tomography with source redshifts zs = [0.5, 1.0, 1.5, 2.0] and corresponding galaxy number densities ngal = [11.02, 11.90, 5.45, 1.45]. The dotted black line is the fiducial model: [∑mν, Ωm, 109 As]=[0.1, 0.3, 2.1]. Left panel: constraints from the power spectrum (light blue contours) computed on noisy maps smoothed with a Gaussian filter with θker = 1 arcmin, compared to constraints from the starlet ℓ1-norm (dark blue contours) computed on noisy maps filtered with a four-scale starlet kernel. Right panel: constraints from the combination of peaks and voids (magenta contours) computed on noisy maps smoothed with a Gaussian filter with θker = 2 arcmin compared to constraints from starlet peak counts (green contours), starlet extrema (orange contours), and the ℓ1-norm (dark blue contours), computed on noisy maps filtered with a four-scale starlet kernel.
Current usage metrics show cumulative count of Article Views (full-text article views including HTML views, PDF and ePub downloads, according to the available data) and Abstracts Views on Vision4Press platform.
Data correspond to usage on the plateform after 2015. The current usage metrics is available 48-96 hours after online publication and is updated daily on week days.
Initial download of the metrics may take a while.