Fig. 4.
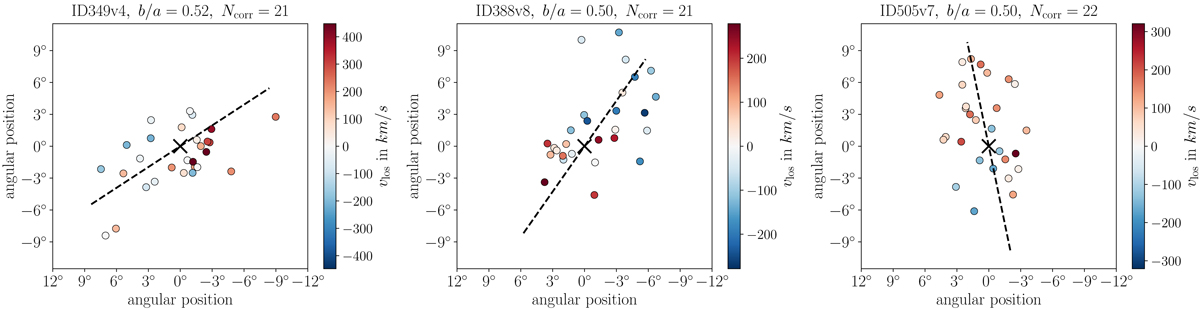
Mock-observed on-sky satellite distributions of the three simulated systems that have satellite plane parameters as extreme as observed. The satellite galaxies (circles) are color coded by their line-of-sight velocity relative to the host (black cross). The dashed lines indicate the major axis of the projected distribution of satellites. The top labels give the minor-to-major axis flattening b/a of the on-sky distribution for the simulated systems, as well as the number of correlated velocities Ncorr.
Current usage metrics show cumulative count of Article Views (full-text article views including HTML views, PDF and ePub downloads, according to the available data) and Abstracts Views on Vision4Press platform.
Data correspond to usage on the plateform after 2015. The current usage metrics is available 48-96 hours after online publication and is updated daily on week days.
Initial download of the metrics may take a while.