Fig. 3.
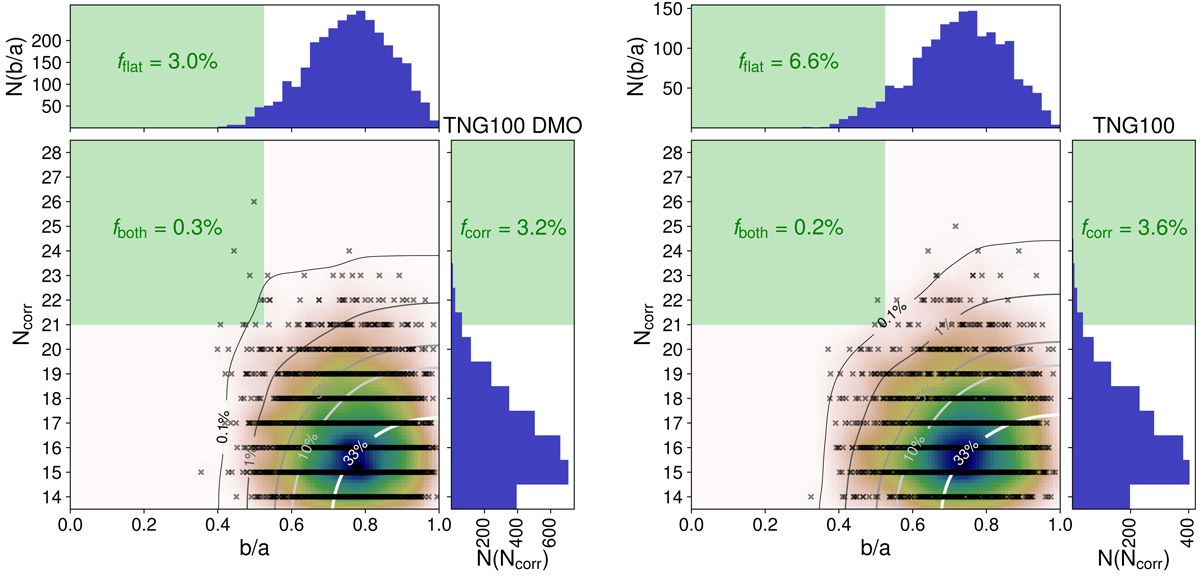
Mock-observed satellite systems around Cen A analogs from the Illustris TNG-100 simulation, considering both its dark-matter-only run (left) and hydrodynamical run (right). The vertical axis plots the number of kinematically correlated satellites Ncorr, with Ncorr = 21 for the observed Cen A system. The horizontal axis plots the on-sky axis-ratio flattening b/a. The histograms show the number of realizations with a given axis ratio N(b/a) and a given number of correlated velocities N(Ncorr), respectively. The color maps indicate the density of simulated systems, while the contours indicate what fraction of simulated systems are more extreme than the parameter combination. The green shaded regions indicate parameter combinations that are as extreme or more as the observed Cen A system, while fflat, fcorr, and fboth report the fraction of mock systems that are at least as flattened as the observed system, at least as kinematically correlated, or both simultaneously.
Current usage metrics show cumulative count of Article Views (full-text article views including HTML views, PDF and ePub downloads, according to the available data) and Abstracts Views on Vision4Press platform.
Data correspond to usage on the plateform after 2015. The current usage metrics is available 48-96 hours after online publication and is updated daily on week days.
Initial download of the metrics may take a while.