Fig. 2.
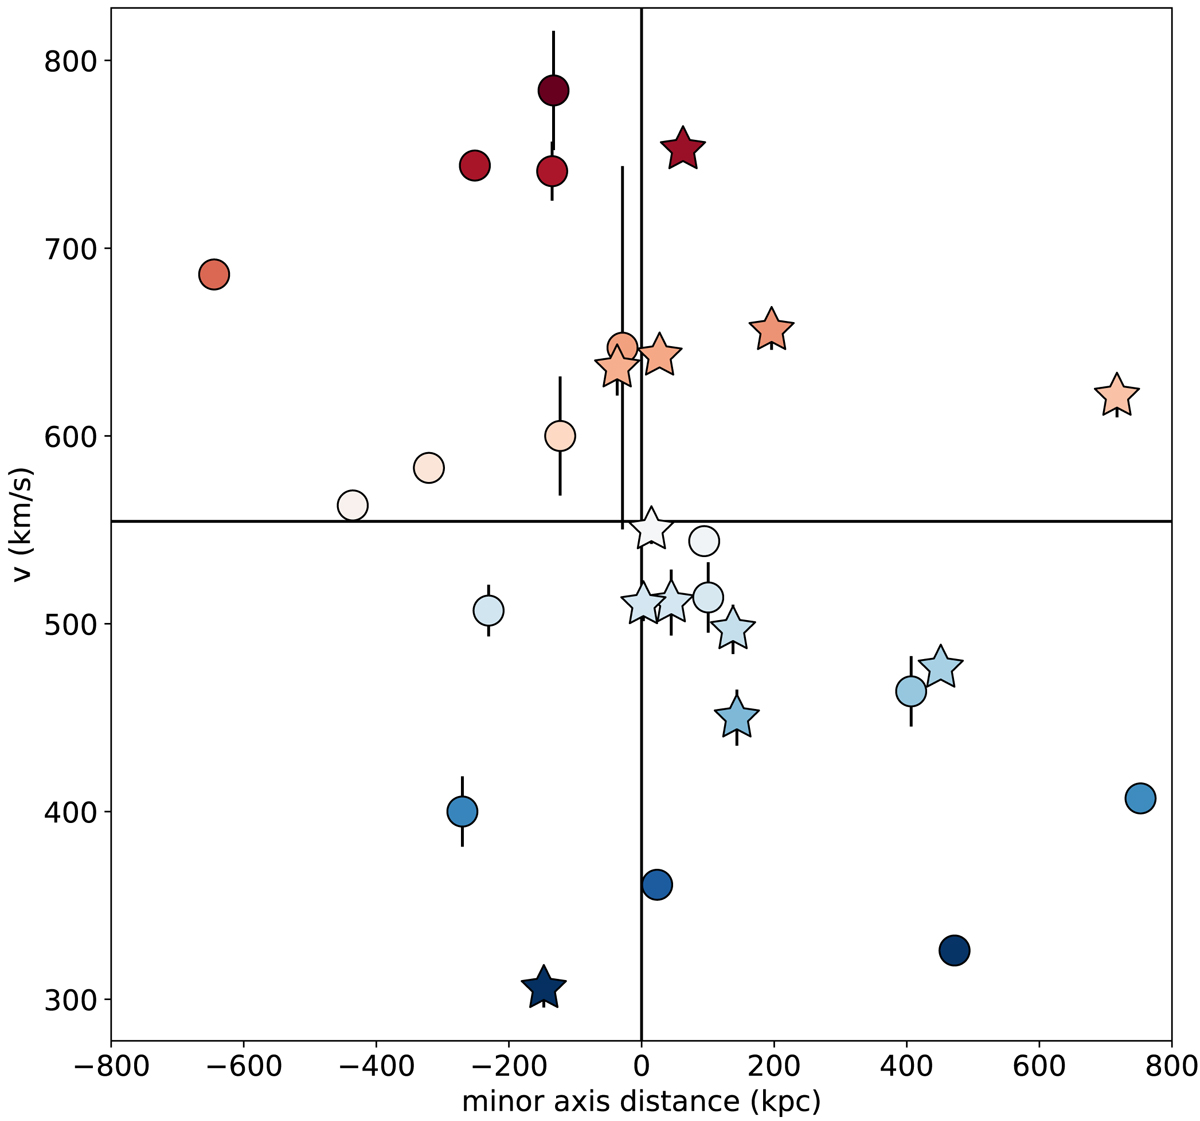
Position-velocity diagram for the dwarf galaxy satellite system of Cen A. The x-axis represents the distance from the minor axis (i.e., along the major axis) derived from the satellite distribution. The filled circles show the dwarf galaxies used in Müller et al. (2018b), and the stars illustrate the new data. The uncertainties are always plotted, but often smaller than the dots. Approaching and receding galaxies with respect to the mean of the group are shown in blue and red, respectively, as in Fig. 1.
Current usage metrics show cumulative count of Article Views (full-text article views including HTML views, PDF and ePub downloads, according to the available data) and Abstracts Views on Vision4Press platform.
Data correspond to usage on the plateform after 2015. The current usage metrics is available 48-96 hours after online publication and is updated daily on week days.
Initial download of the metrics may take a while.