Fig. 1.
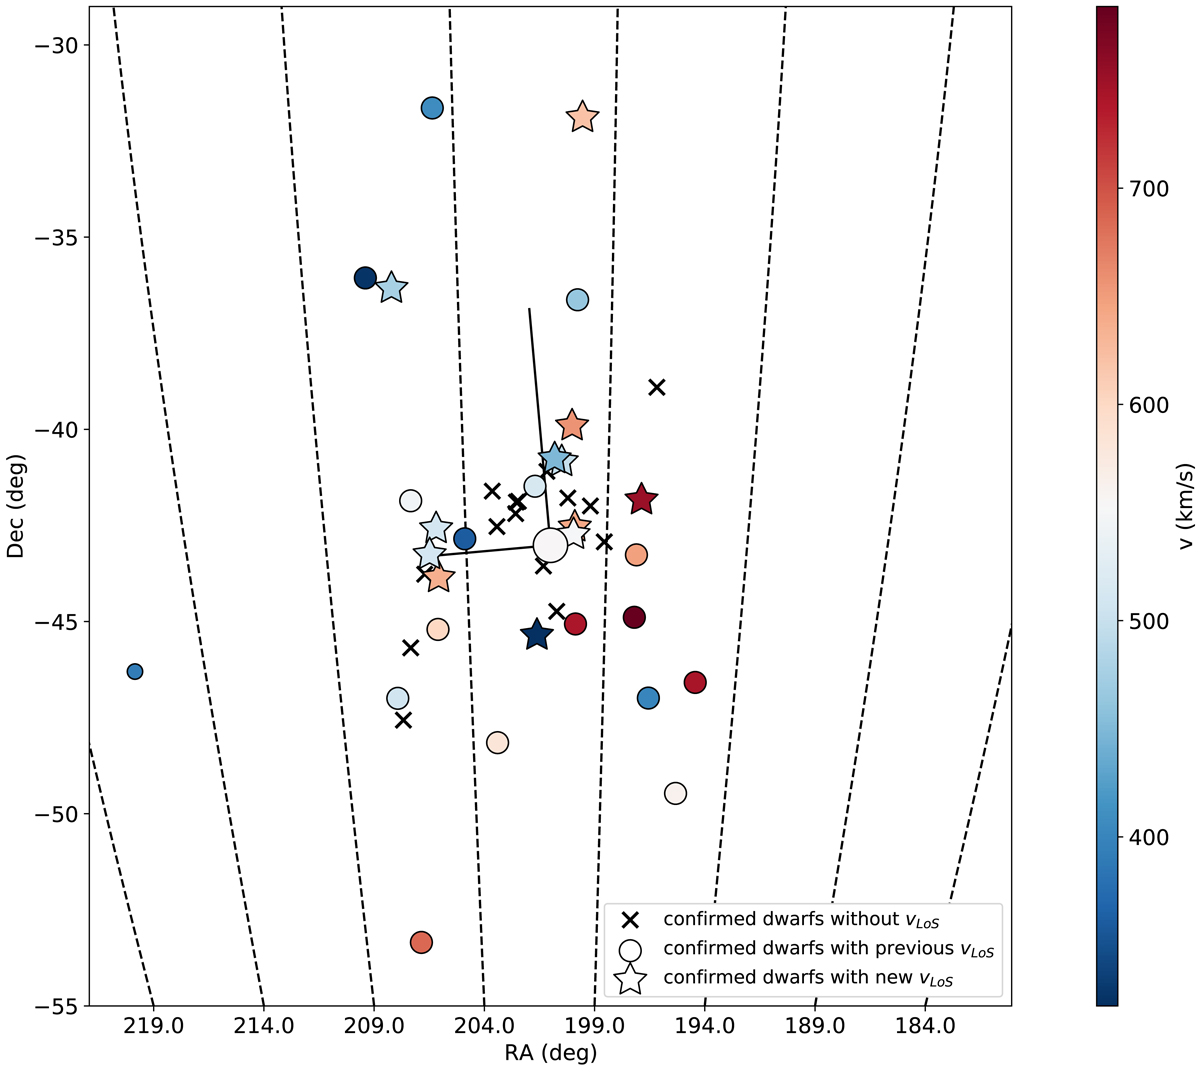
On-sky distribution of the Cen A satellite system within 800 kpc. The circles correspond to the dwarf galaxies studied in Müller et al. (2018b), the stars to the newly observed dwarfs (Müller et al. 2021). The colors indicate whether the galaxies are redshifted or blueshifted with respect to the systemic velocity of Cen A (shown with a large open circle). The crosses are dwarf galaxies with known distances but without velocity information, and the small blue dot to the left is a dwarf galaxy that does not belong to the plane-of-satellites. The black lines centered on Cen A correspond to the major and minor axes of the satellite distribution.
Current usage metrics show cumulative count of Article Views (full-text article views including HTML views, PDF and ePub downloads, according to the available data) and Abstracts Views on Vision4Press platform.
Data correspond to usage on the plateform after 2015. The current usage metrics is available 48-96 hours after online publication and is updated daily on week days.
Initial download of the metrics may take a while.