Fig. 9
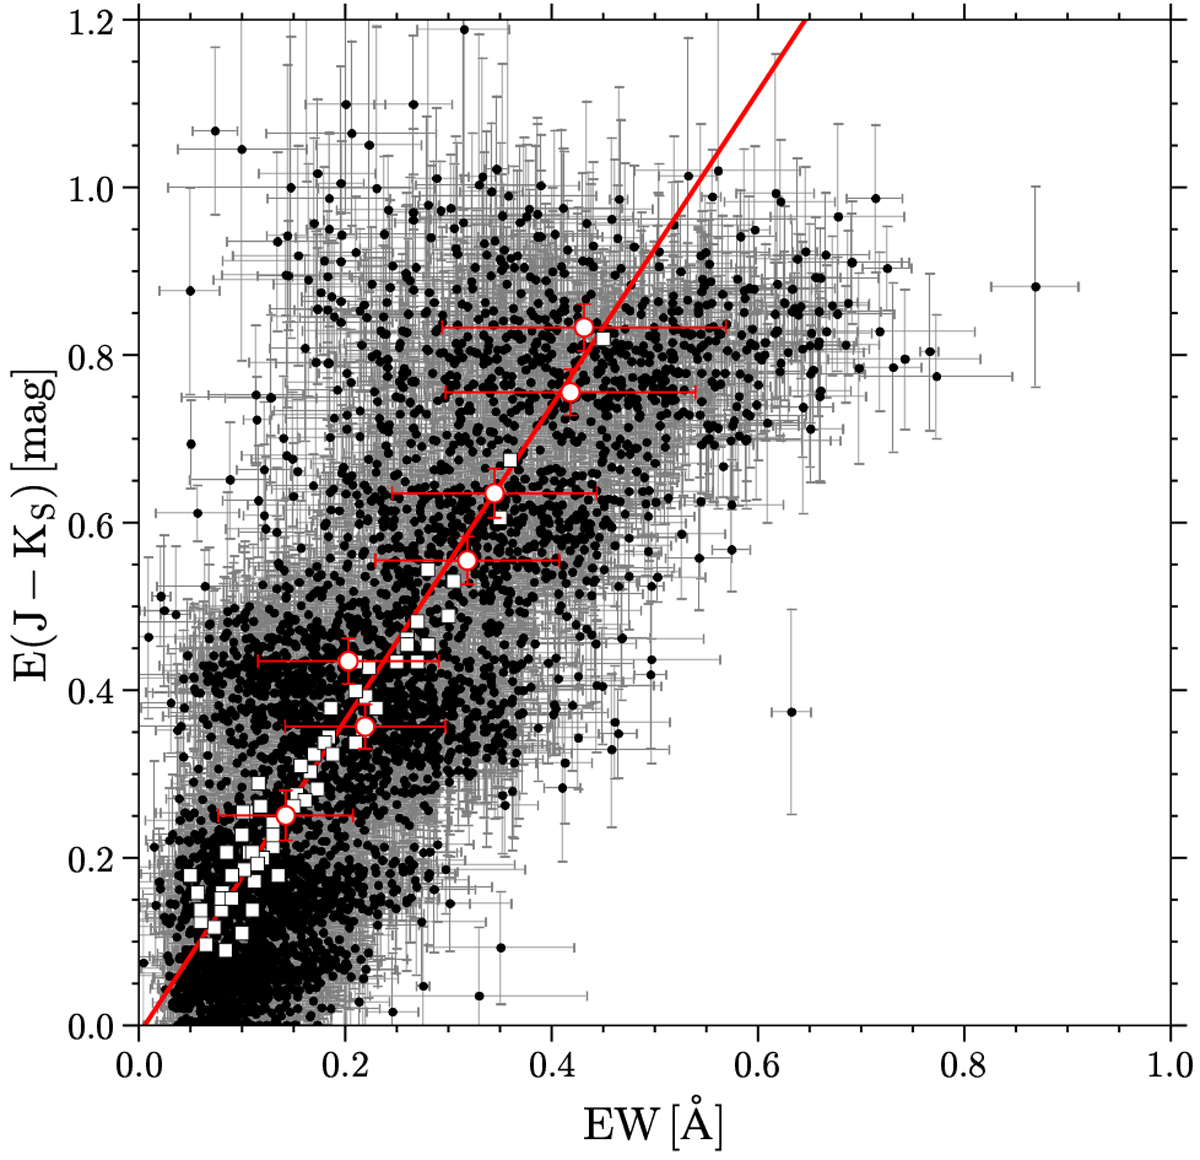
Correlation between the EW of the Gaia DIB and the reddening E(J − KS). The black points are the measurements from individual targets. The white and red dots are the median values taken from different reddening bins. The red error bars present the standard deviations in each bins. The red line is fit to the white and red dots. The white squares are the results from Munari et al. (2008).
Current usage metrics show cumulative count of Article Views (full-text article views including HTML views, PDF and ePub downloads, according to the available data) and Abstracts Views on Vision4Press platform.
Data correspond to usage on the plateform after 2015. The current usage metrics is available 48-96 hours after online publication and is updated daily on week days.
Initial download of the metrics may take a while.