Fig. 7
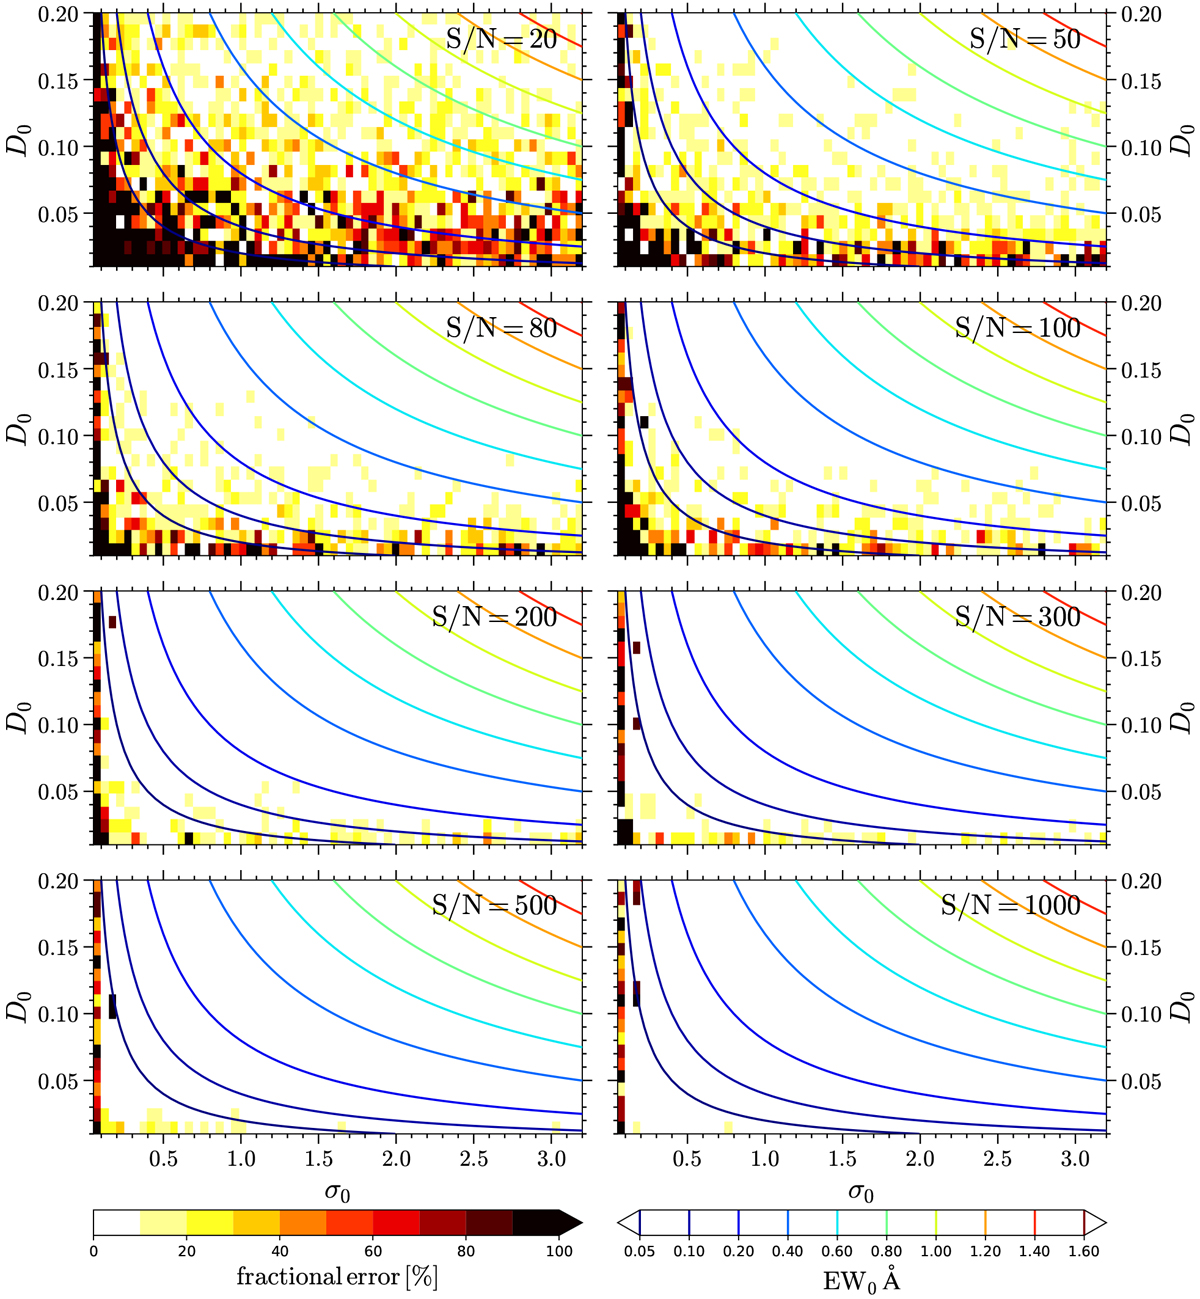
Distribution of the fractional error (|EW0 −EWf|∕EW0 × 100) in the D0 − σ0 plane, overlapped with the contours of EW0. In each subpanel, the fitting results are from the pseudo-spectra with the same S/N but various profiles. The colorbar is shown within 100%, while the fractional error may exceed it in some very small EW0 regions.
Current usage metrics show cumulative count of Article Views (full-text article views including HTML views, PDF and ePub downloads, according to the available data) and Abstracts Views on Vision4Press platform.
Data correspond to usage on the plateform after 2015. The current usage metrics is available 48-96 hours after online publication and is updated daily on week days.
Initial download of the metrics may take a while.