Fig. 4
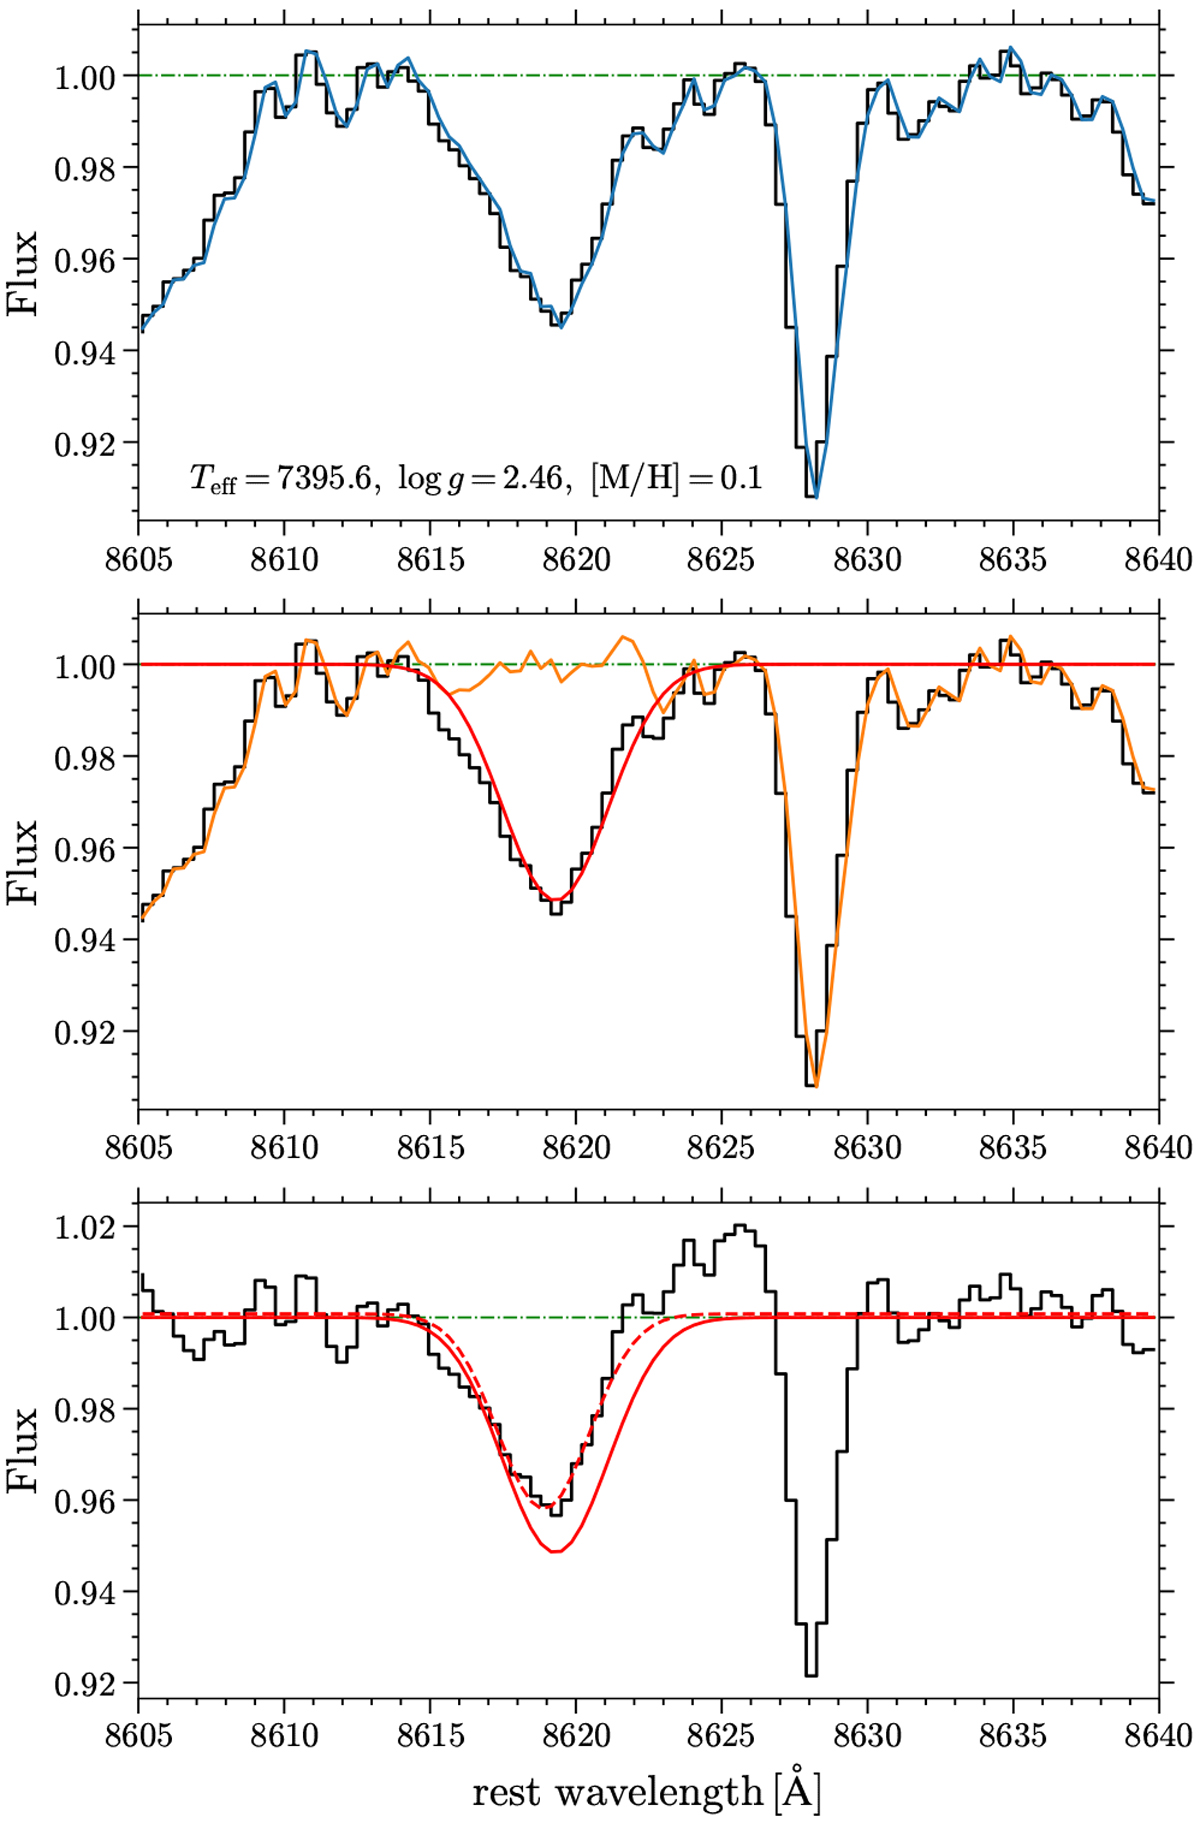
Fitting by GPR for HIS of the star HD 166167 observed by the RAVE survey (R = 7500). Top: locally renormalized observed spectrum (black line), and the completed fit by GPR (blue curve). The atmospheric parameters from RAVE–DR6 are also indicated. Middle: decomposition of the blue curve in the top panel. The red line represents the Gaussian DIB profile, and the orange line given by the kernels of GP describes the remainder of the spectrum. Bottom: reshaped spectrum based on the first fit (black line; see Sect. 2.6.2). The solid and dashed DIB profiles are from the first (finally selected) and second fits, respectively.
Current usage metrics show cumulative count of Article Views (full-text article views including HTML views, PDF and ePub downloads, according to the available data) and Abstracts Views on Vision4Press platform.
Data correspond to usage on the plateform after 2015. The current usage metrics is available 48-96 hours after online publication and is updated daily on week days.
Initial download of the metrics may take a while.