Fig. 3
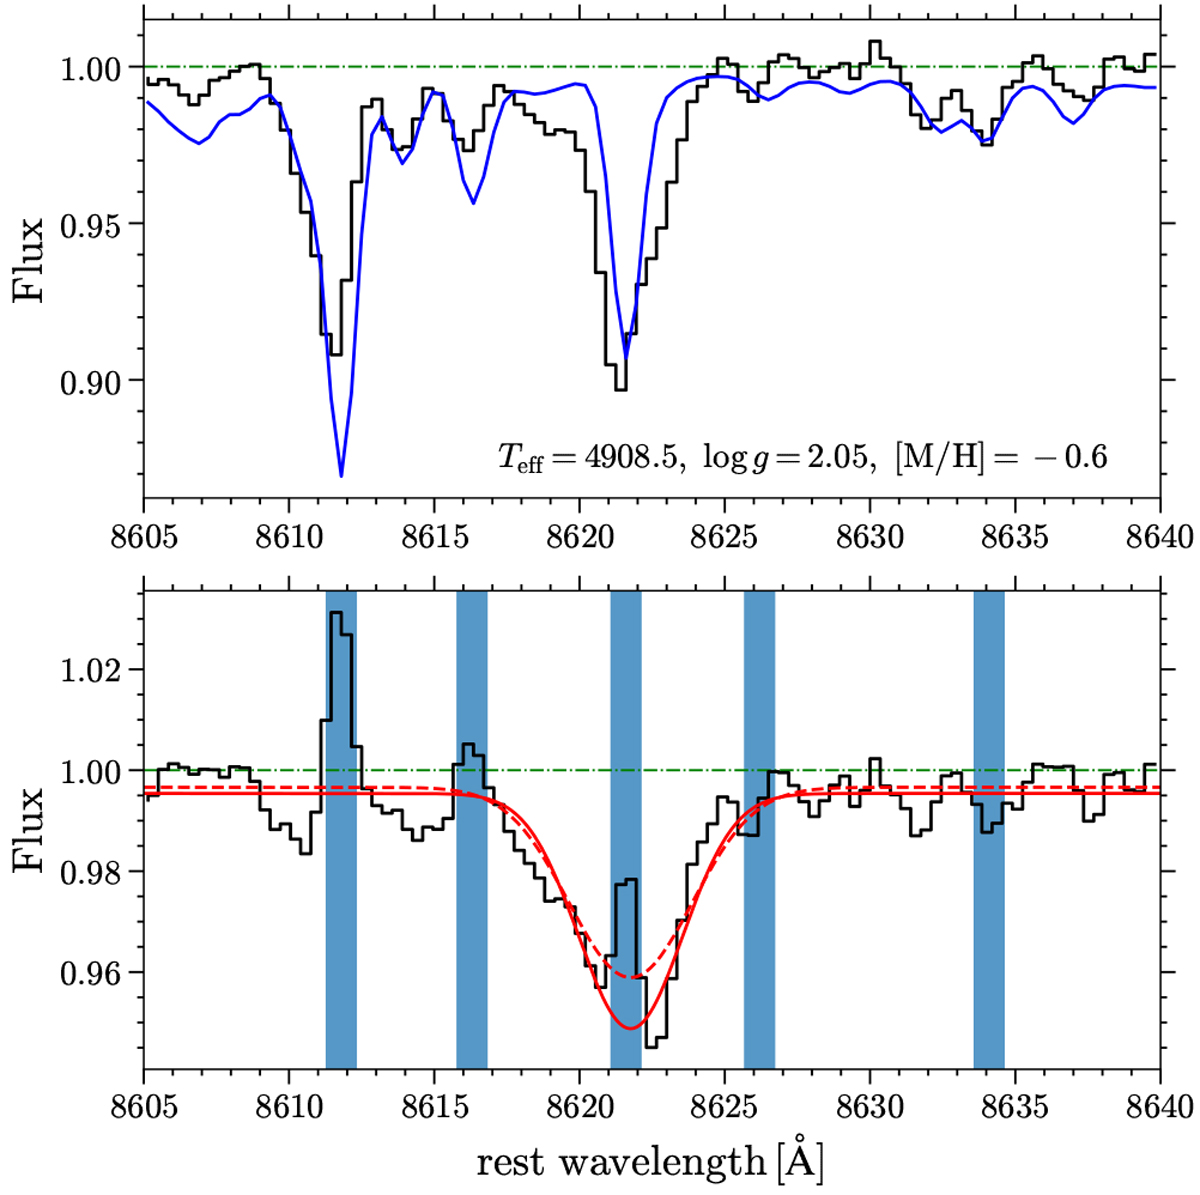
Gaussian model for CIS of the star HD 149349 observed by the RAVE survey (R = 7500). Upper panel: black and blue lines show the observed and synthetic spectra, respectively. The atmospheric parameters from RAVE–DR6 are also indicated. Lower panel: renormalized interstellar spectrum represented by the black line. The dashed and solid red lines represent the profiles from the first and second (finally selected) fits, respectively. The blue shades indicate the masked regions discussed in Sect. 2.6.2.
Current usage metrics show cumulative count of Article Views (full-text article views including HTML views, PDF and ePub downloads, according to the available data) and Abstracts Views on Vision4Press platform.
Data correspond to usage on the plateform after 2015. The current usage metrics is available 48-96 hours after online publication and is updated daily on week days.
Initial download of the metrics may take a while.