Fig. 2
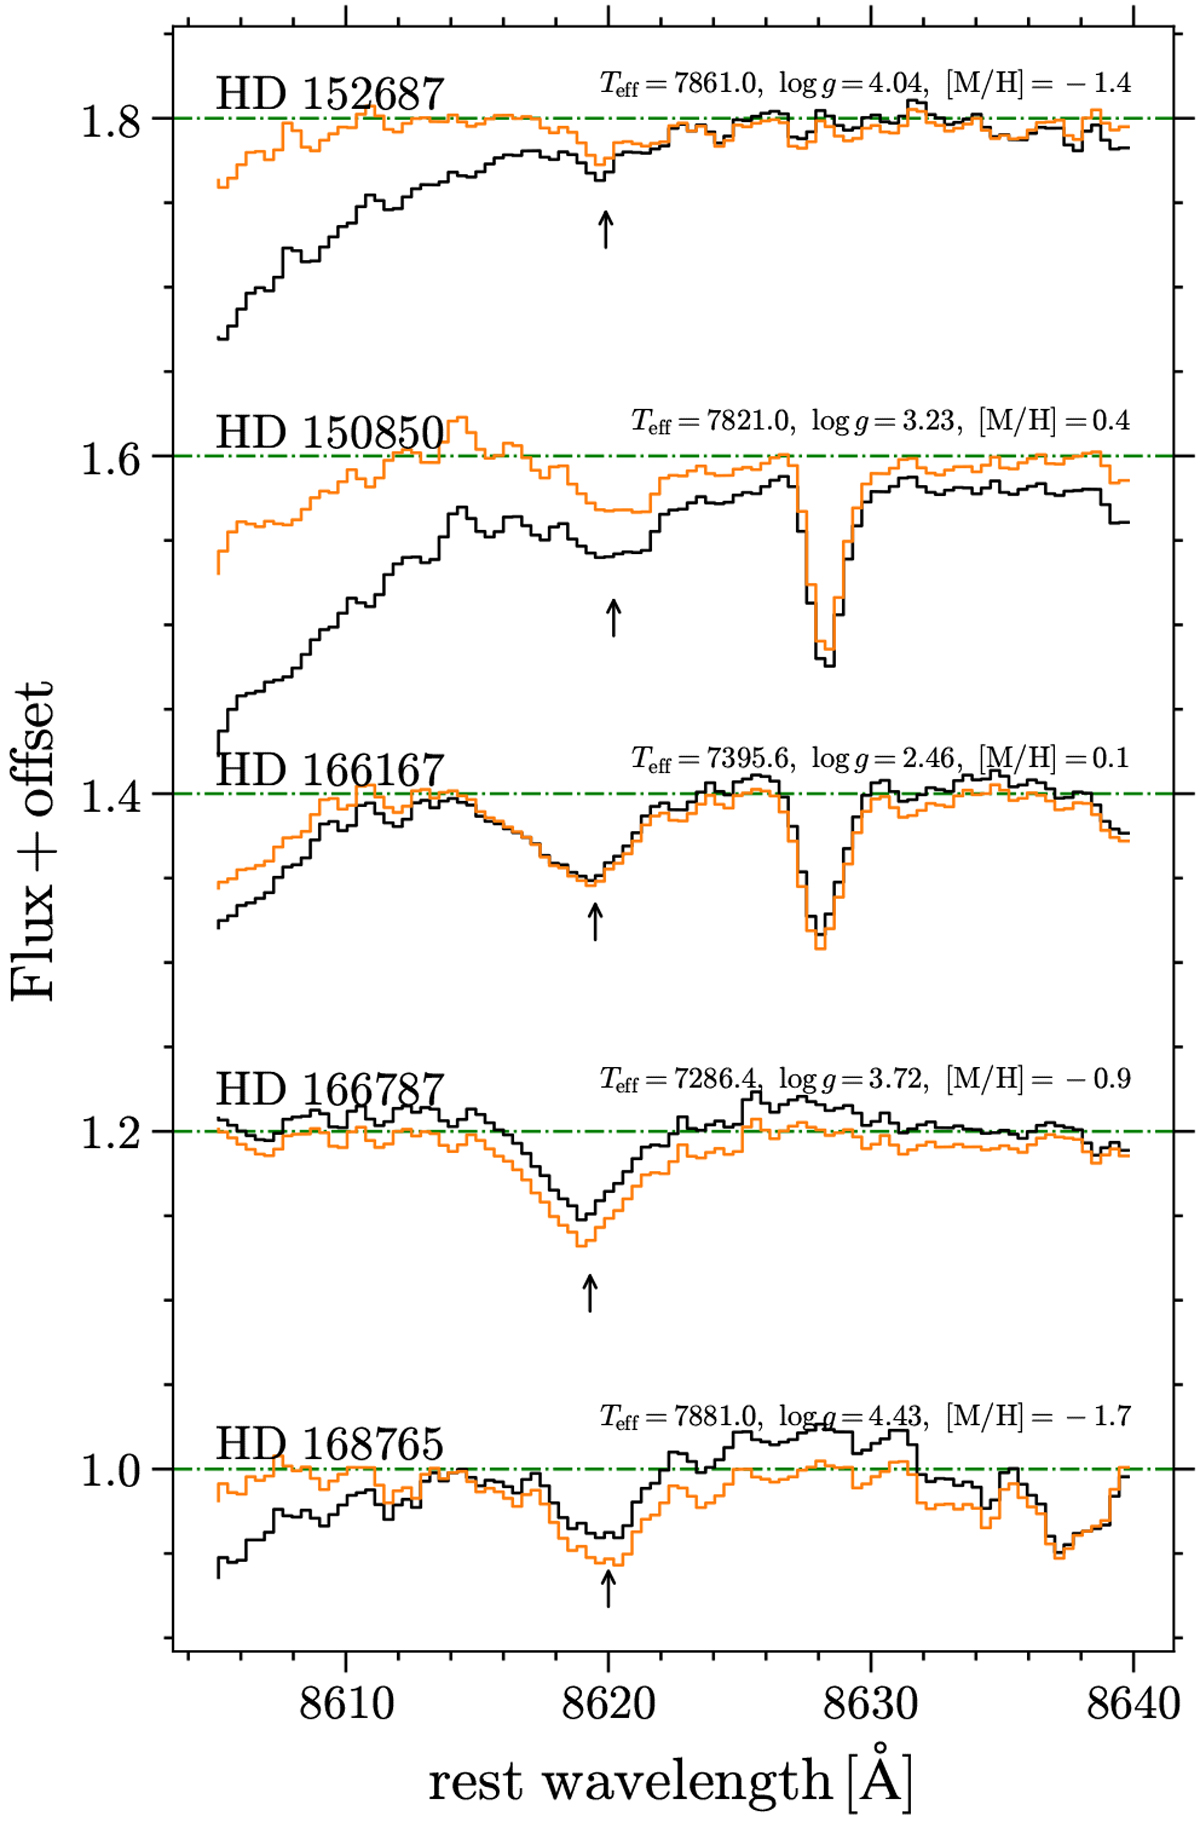
Examples of the local renormalization for five RAVE spectra (R = 7500) of hot stars. The black lines are the original spectra, and the orange lines indicate the renormalized spectra. The black arrows indicate the Gaia DIB. The names and atmospheric parameters are also indicated. The strong stellar feature near the DIB profile seen on HD 150850 and HD 166167 is the N I line.
Current usage metrics show cumulative count of Article Views (full-text article views including HTML views, PDF and ePub downloads, according to the available data) and Abstracts Views on Vision4Press platform.
Data correspond to usage on the plateform after 2015. The current usage metrics is available 48-96 hours after online publication and is updated daily on week days.
Initial download of the metrics may take a while.