Fig. 14
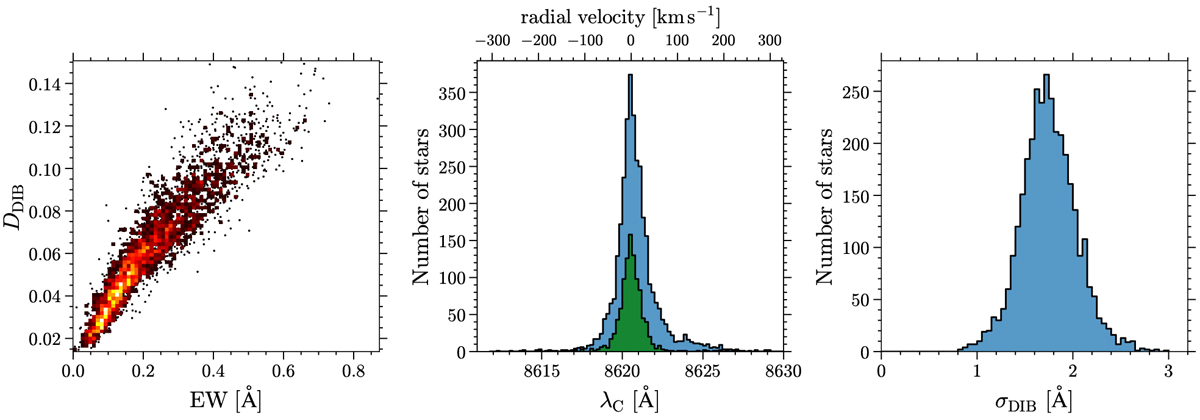
Distributions of the DIB parameters. Left panel: depth D vs. EW. The color represents the number density. Middle panel: measured line center λC in the heliocentric frame. The upper axis shows the corresponding radial velocities of the DIB carriers. The green histograms present the subsample selected to determine the rest-frame wavelength (see Sect. 4.2.2). Right panel: histograms of the width σ.
Current usage metrics show cumulative count of Article Views (full-text article views including HTML views, PDF and ePub downloads, according to the available data) and Abstracts Views on Vision4Press platform.
Data correspond to usage on the plateform after 2015. The current usage metrics is available 48-96 hours after online publication and is updated daily on week days.
Initial download of the metrics may take a while.