Fig. 11
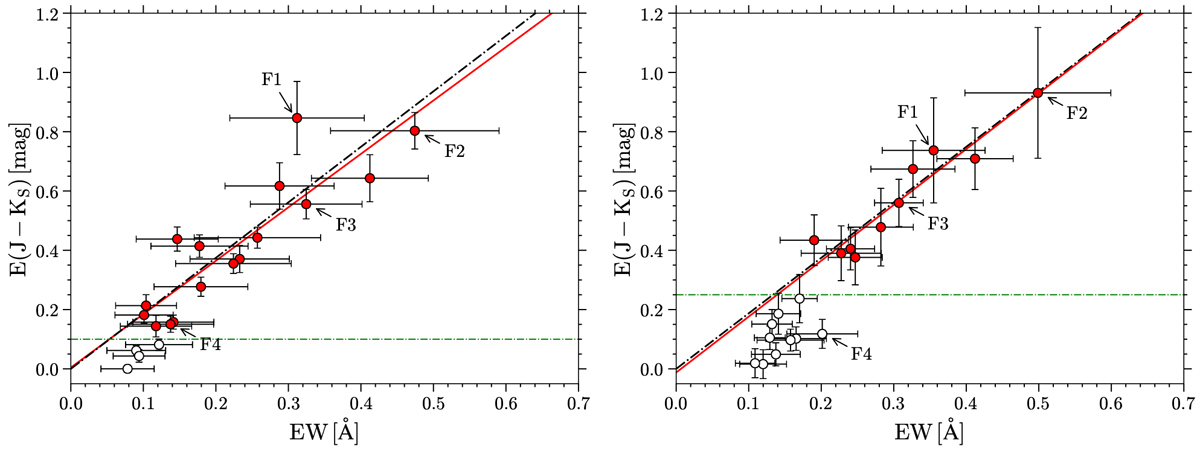
Correlation between the EW of the Gaia DIB and the reddening E(J − KS) derived from individual GIBS fields before (left panel) and after (right panel) the correction. The red lines are fit to the red dots in each panel, and white dots are discarded. The dot-dashed black lines present the relation derived by Munari et al. (2008). The dot-dashed green lines indicate E(J − KS) = 0.10 and 0.25 mag in left and right panels, respectively. Four fields are indicated in each panel for comparison, and a detailed discussion ispresented in Sect. 4.1.2 and Appendix A.
Current usage metrics show cumulative count of Article Views (full-text article views including HTML views, PDF and ePub downloads, according to the available data) and Abstracts Views on Vision4Press platform.
Data correspond to usage on the plateform after 2015. The current usage metrics is available 48-96 hours after online publication and is updated daily on week days.
Initial download of the metrics may take a while.