Fig. 2.
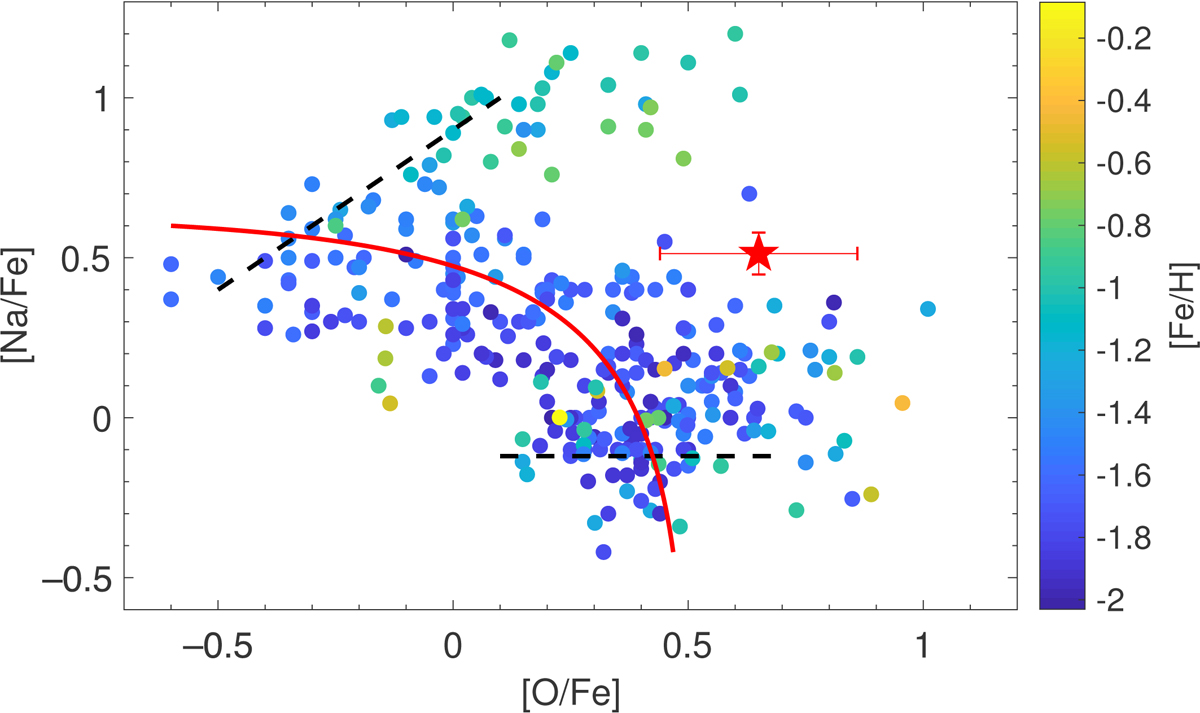
Sodium-oxygen anticorrelation using data from Marino et al. (2011) and Simpson et al. (2020), color-coded by metallicity. Star J110842 is indicated by a red star. We also indicate the empirical separations into first, second, and extreme generations (dashed black) and the simplistic dilution model (red line) by Carretta et al. (2009).
Current usage metrics show cumulative count of Article Views (full-text article views including HTML views, PDF and ePub downloads, according to the available data) and Abstracts Views on Vision4Press platform.
Data correspond to usage on the plateform after 2015. The current usage metrics is available 48-96 hours after online publication and is updated daily on week days.
Initial download of the metrics may take a while.