Fig. 5
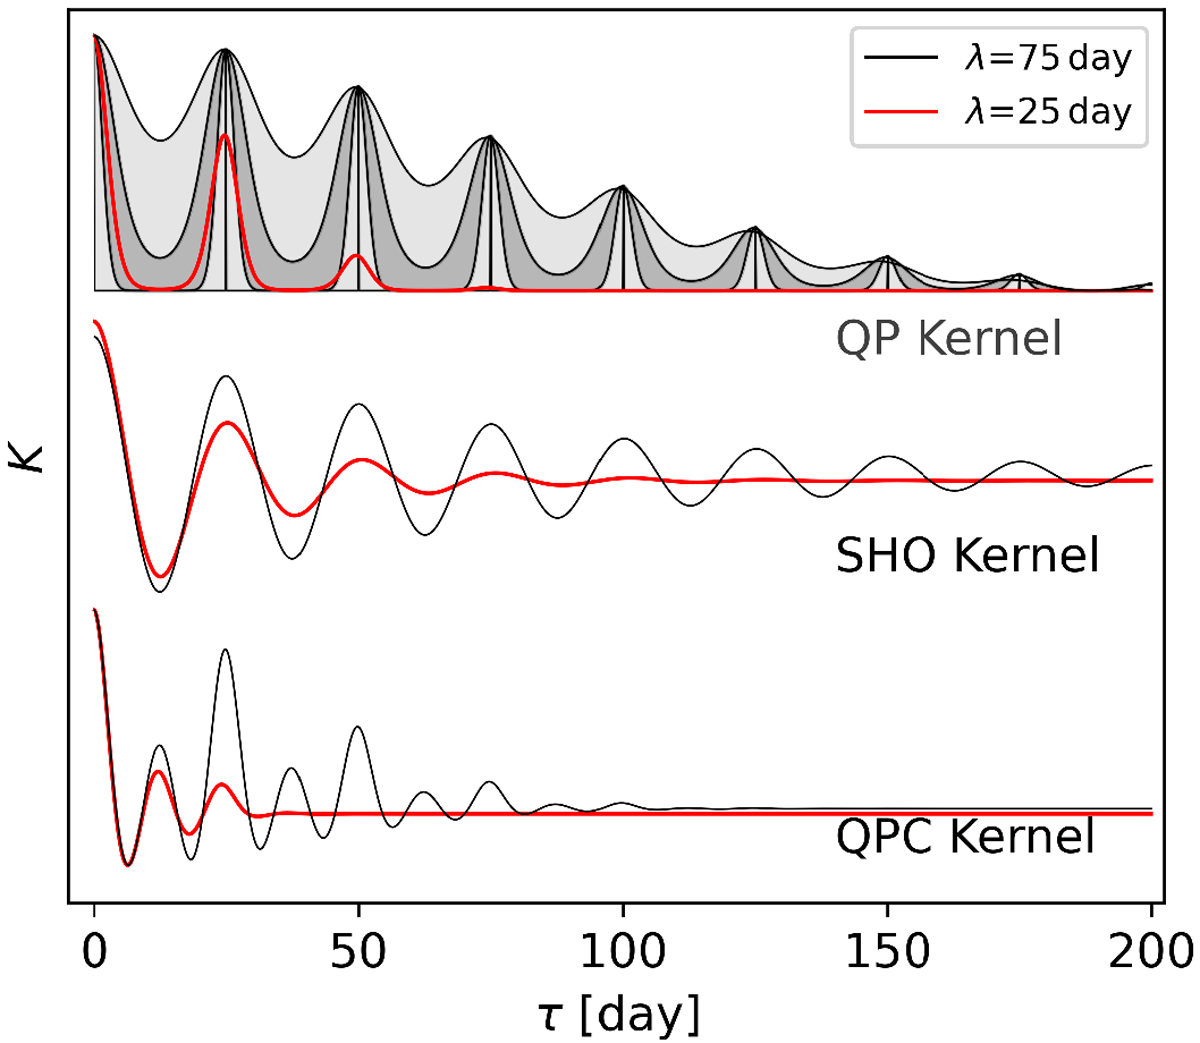
Graphic representation of the three kernels used in this study: the quasi-periodic (QP) kernel as implemented in the george code (top), the simple harmonic oscillator (SHO) as implemented in the celerite code (middle panel), and the quasi-periodic and cosine (QPC, bottom) kernel introduced in this work, for P = 25 days. The x-axis is the time-lag τ between two data points, and the vertical axis is the normalised value of the correlation represented by the kernel. We show the kernels in red for λ = 25 days (w = 0.31) and black forλ = 75 days. For the QP kernel, the light grey area marks 0 < w < 1, whereas the dark grey area marks the interval 0.2 < w < 0.5, which is more physically motivated. The QPC kernel has h2∕h1 = 1.
Current usage metrics show cumulative count of Article Views (full-text article views including HTML views, PDF and ePub downloads, according to the available data) and Abstracts Views on Vision4Press platform.
Data correspond to usage on the plateform after 2015. The current usage metrics is available 48-96 hours after online publication and is updated daily on week days.
Initial download of the metrics may take a while.