Fig. 4
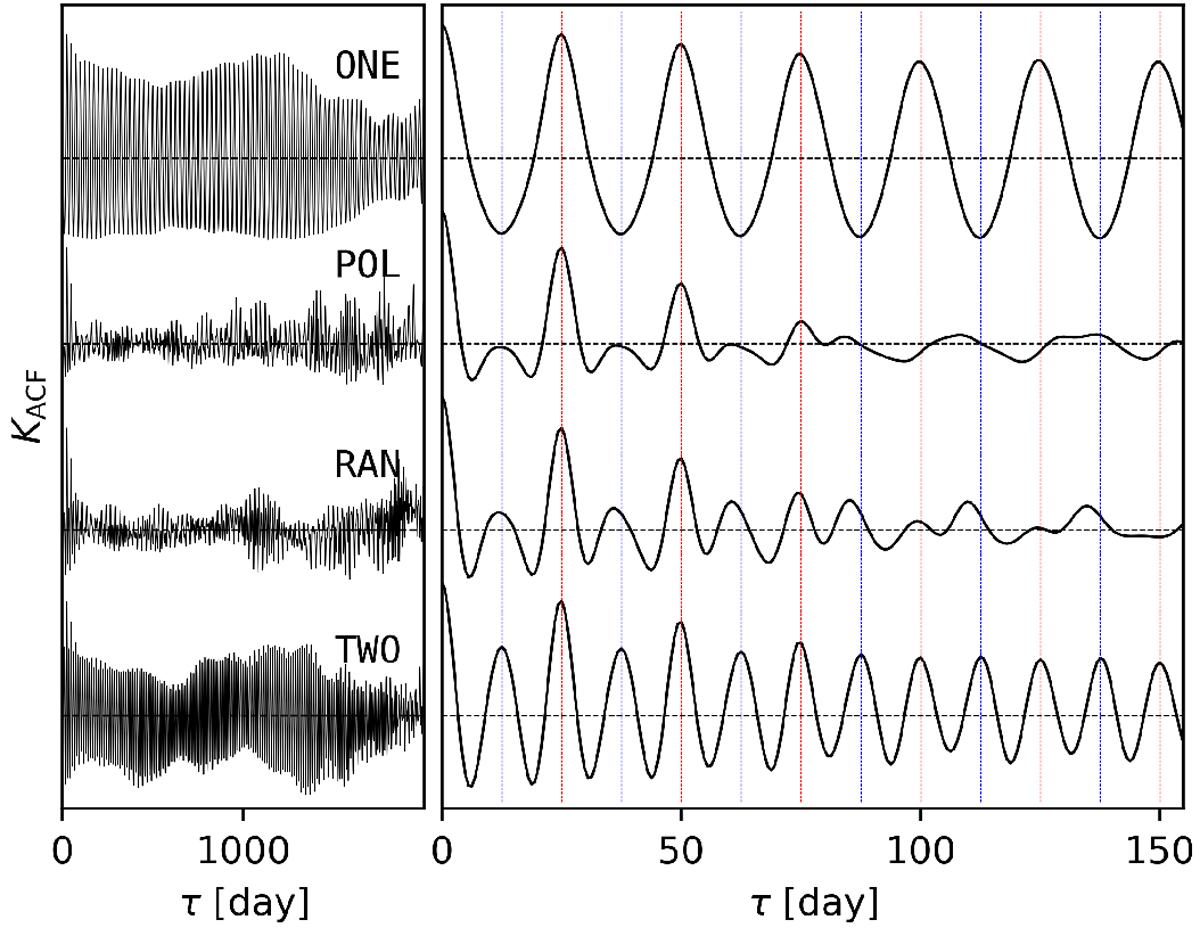
Auto-correlation functions of one example StarSim RV data set for each of the four different spot distributions. Those are, from top to bottom, the ONE, POL, RAN, and TWO configurations. On the left-hand side the ACFs are shown for 0 < t <2000 days and on the right panel for 0 < t < 150 days to highlight the injected stellar rotation at Prot = 25 d, and the spot lifetime of 100 d. Vertical red and blue dashed line mark Prot and Prot∕2 intervals, respectively.
Current usage metrics show cumulative count of Article Views (full-text article views including HTML views, PDF and ePub downloads, according to the available data) and Abstracts Views on Vision4Press platform.
Data correspond to usage on the plateform after 2015. The current usage metrics is available 48-96 hours after online publication and is updated daily on week days.
Initial download of the metrics may take a while.