Fig. 3
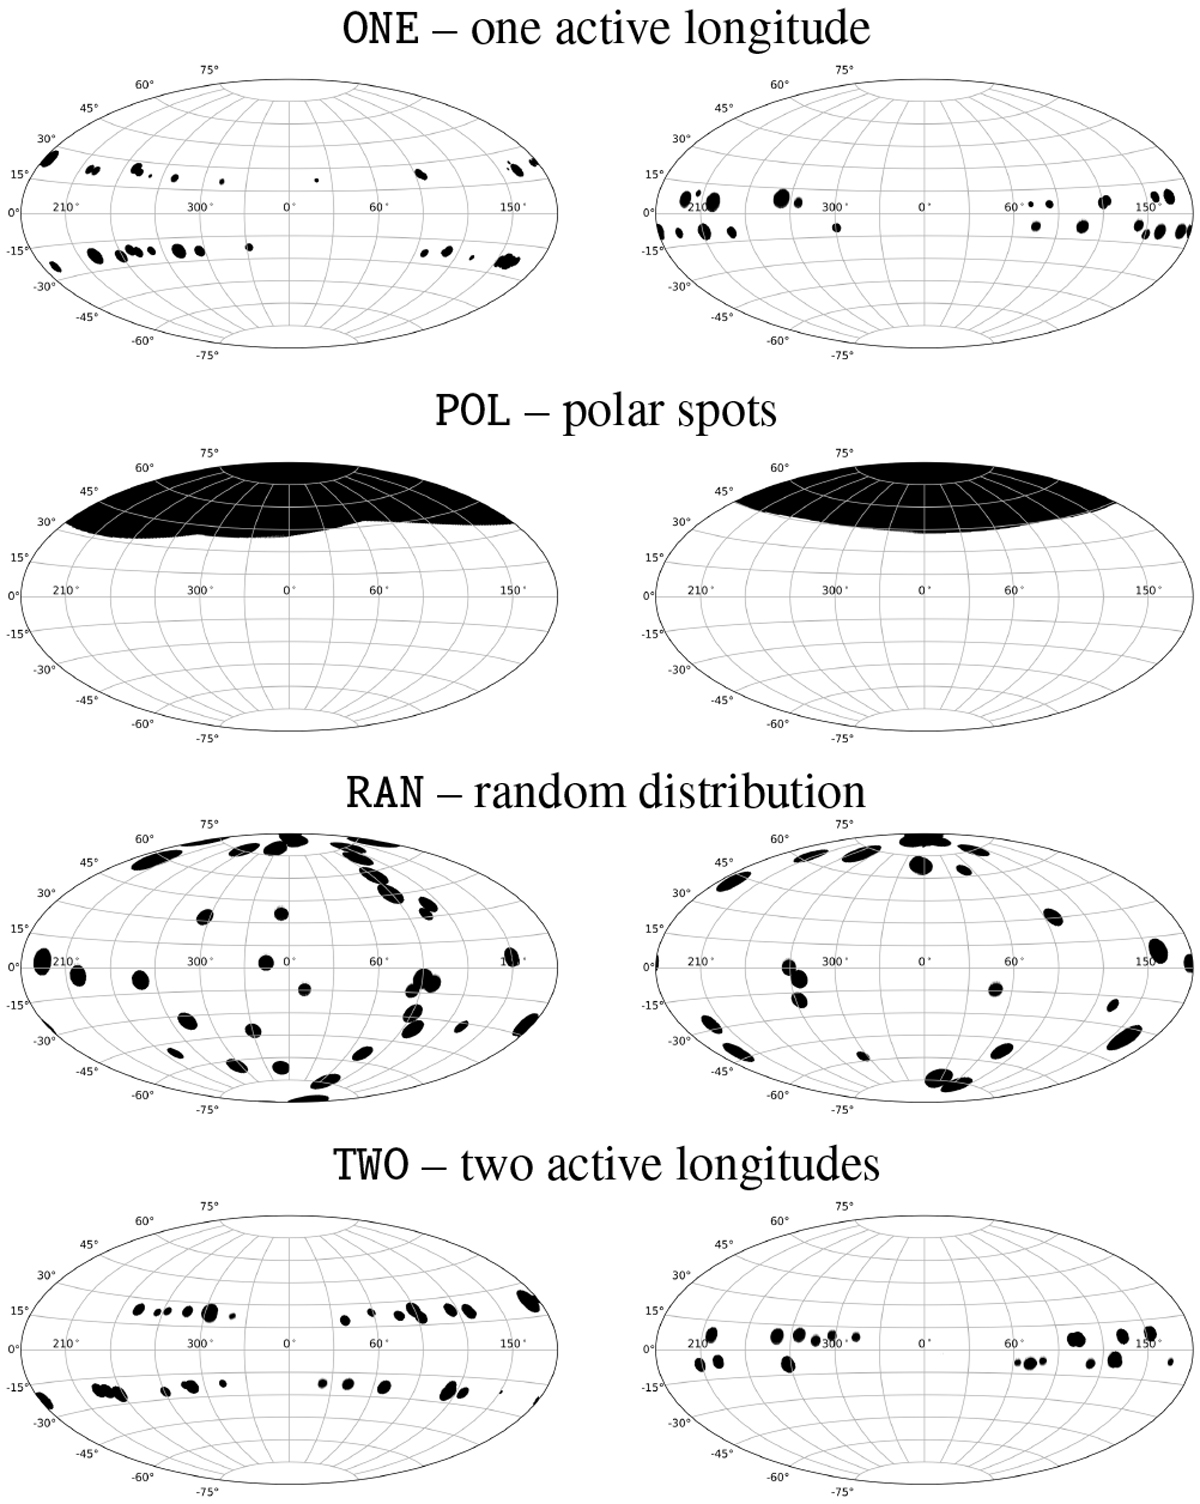
Spot configurations considered in this study. From top to bottom we show spot distributions with one active longitude, ONE (active longitude at 180 deg, σn = 60 deg), with axisymmetric polar spot distribution, POL, with randomly distributed spots, RAN, and with two active longitudes, TWO (90 and 270 deg, σn = 45 deg). The maps depicted illustrate the highest spot coverage at t = 1000 days (left panels)and the lowest coverage at 500 days (right panels). Note, how the spot colatitude is changing for the ONE and TWO models.
Current usage metrics show cumulative count of Article Views (full-text article views including HTML views, PDF and ePub downloads, according to the available data) and Abstracts Views on Vision4Press platform.
Data correspond to usage on the plateform after 2015. The current usage metrics is available 48-96 hours after online publication and is updated daily on week days.
Initial download of the metrics may take a while.