Fig. 6
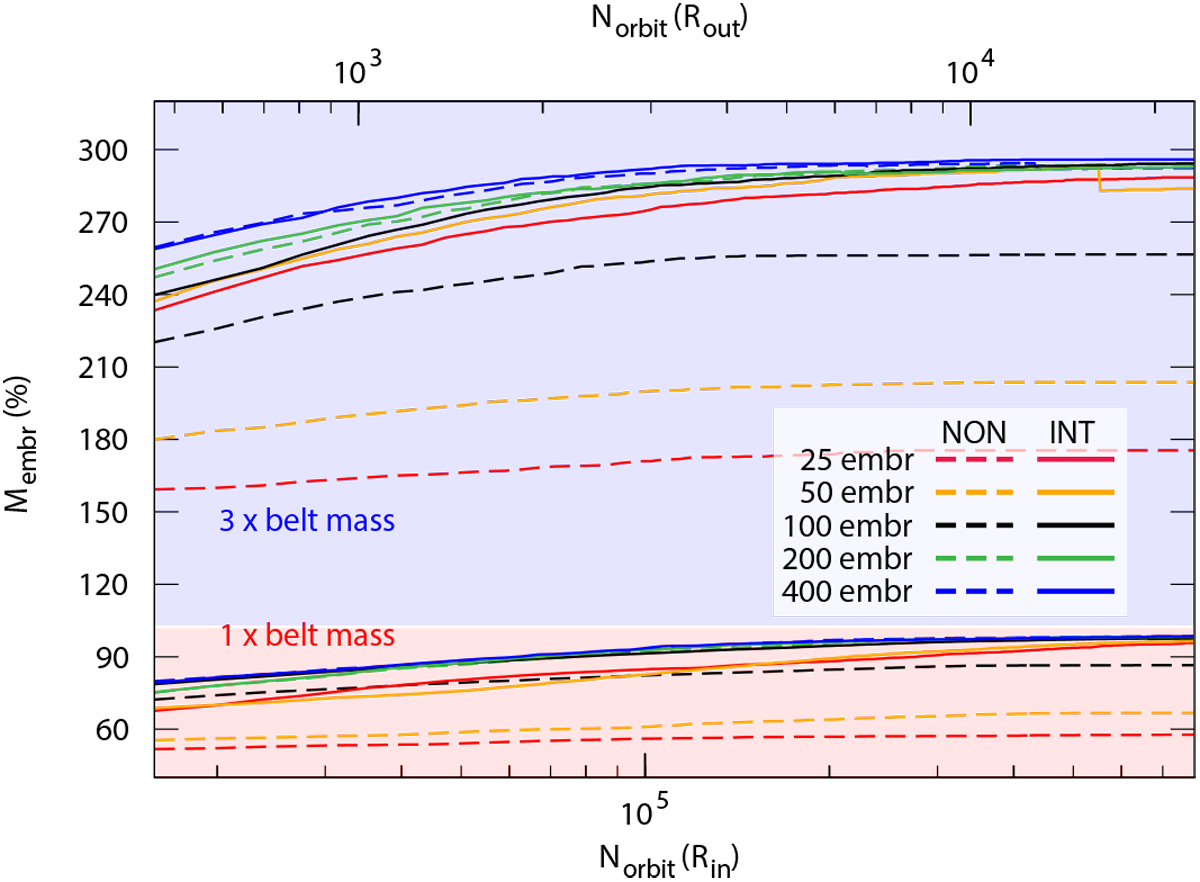
Evolution of the total mass confined by the embryos in the INT and NON models. Red and blue shaded regions indicate the previously used embryo-planetesimal belt mass (7.35 M⊕) and the belt mass that is three times higher (22.05 M⊕), respectively. Colored curves represent models with different initial numbers of embryos (indicated in the key) in the range of 25–400 and with a constant 1000 planetesimals.
Current usage metrics show cumulative count of Article Views (full-text article views including HTML views, PDF and ePub downloads, according to the available data) and Abstracts Views on Vision4Press platform.
Data correspond to usage on the plateform after 2015. The current usage metrics is available 48-96 hours after online publication and is updated daily on week days.
Initial download of the metrics may take a while.