Fig. 2
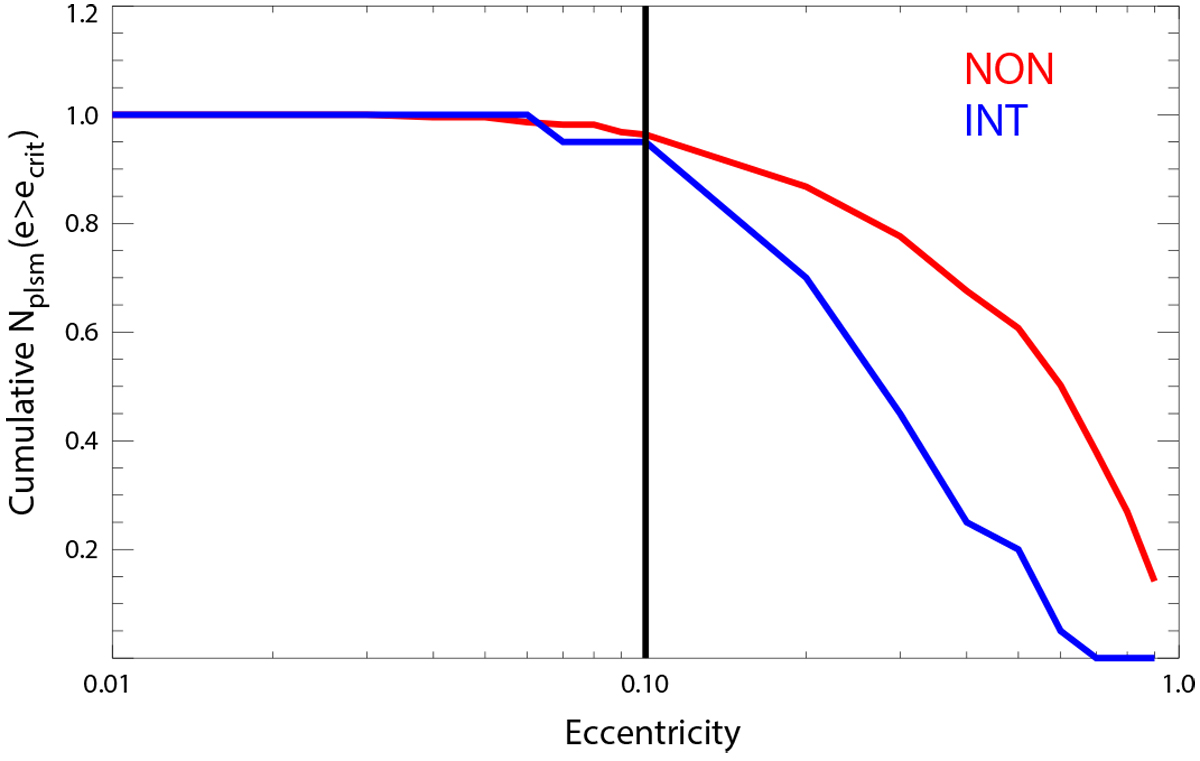
Number of planetesimals (normalized with the initial number of planetesimals) that have an average eccentricity larger than a given eccentricity limit. The red and blue curves show the numbers of planetesimals in the NON and INT models, respectively (we note that the NON curve was divided by ten for the comparison with the INT curve). The vertical black line indicates the critical eccentricity value used to determine the HEP number.
Current usage metrics show cumulative count of Article Views (full-text article views including HTML views, PDF and ePub downloads, according to the available data) and Abstracts Views on Vision4Press platform.
Data correspond to usage on the plateform after 2015. The current usage metrics is available 48-96 hours after online publication and is updated daily on week days.
Initial download of the metrics may take a while.