Fig. 1
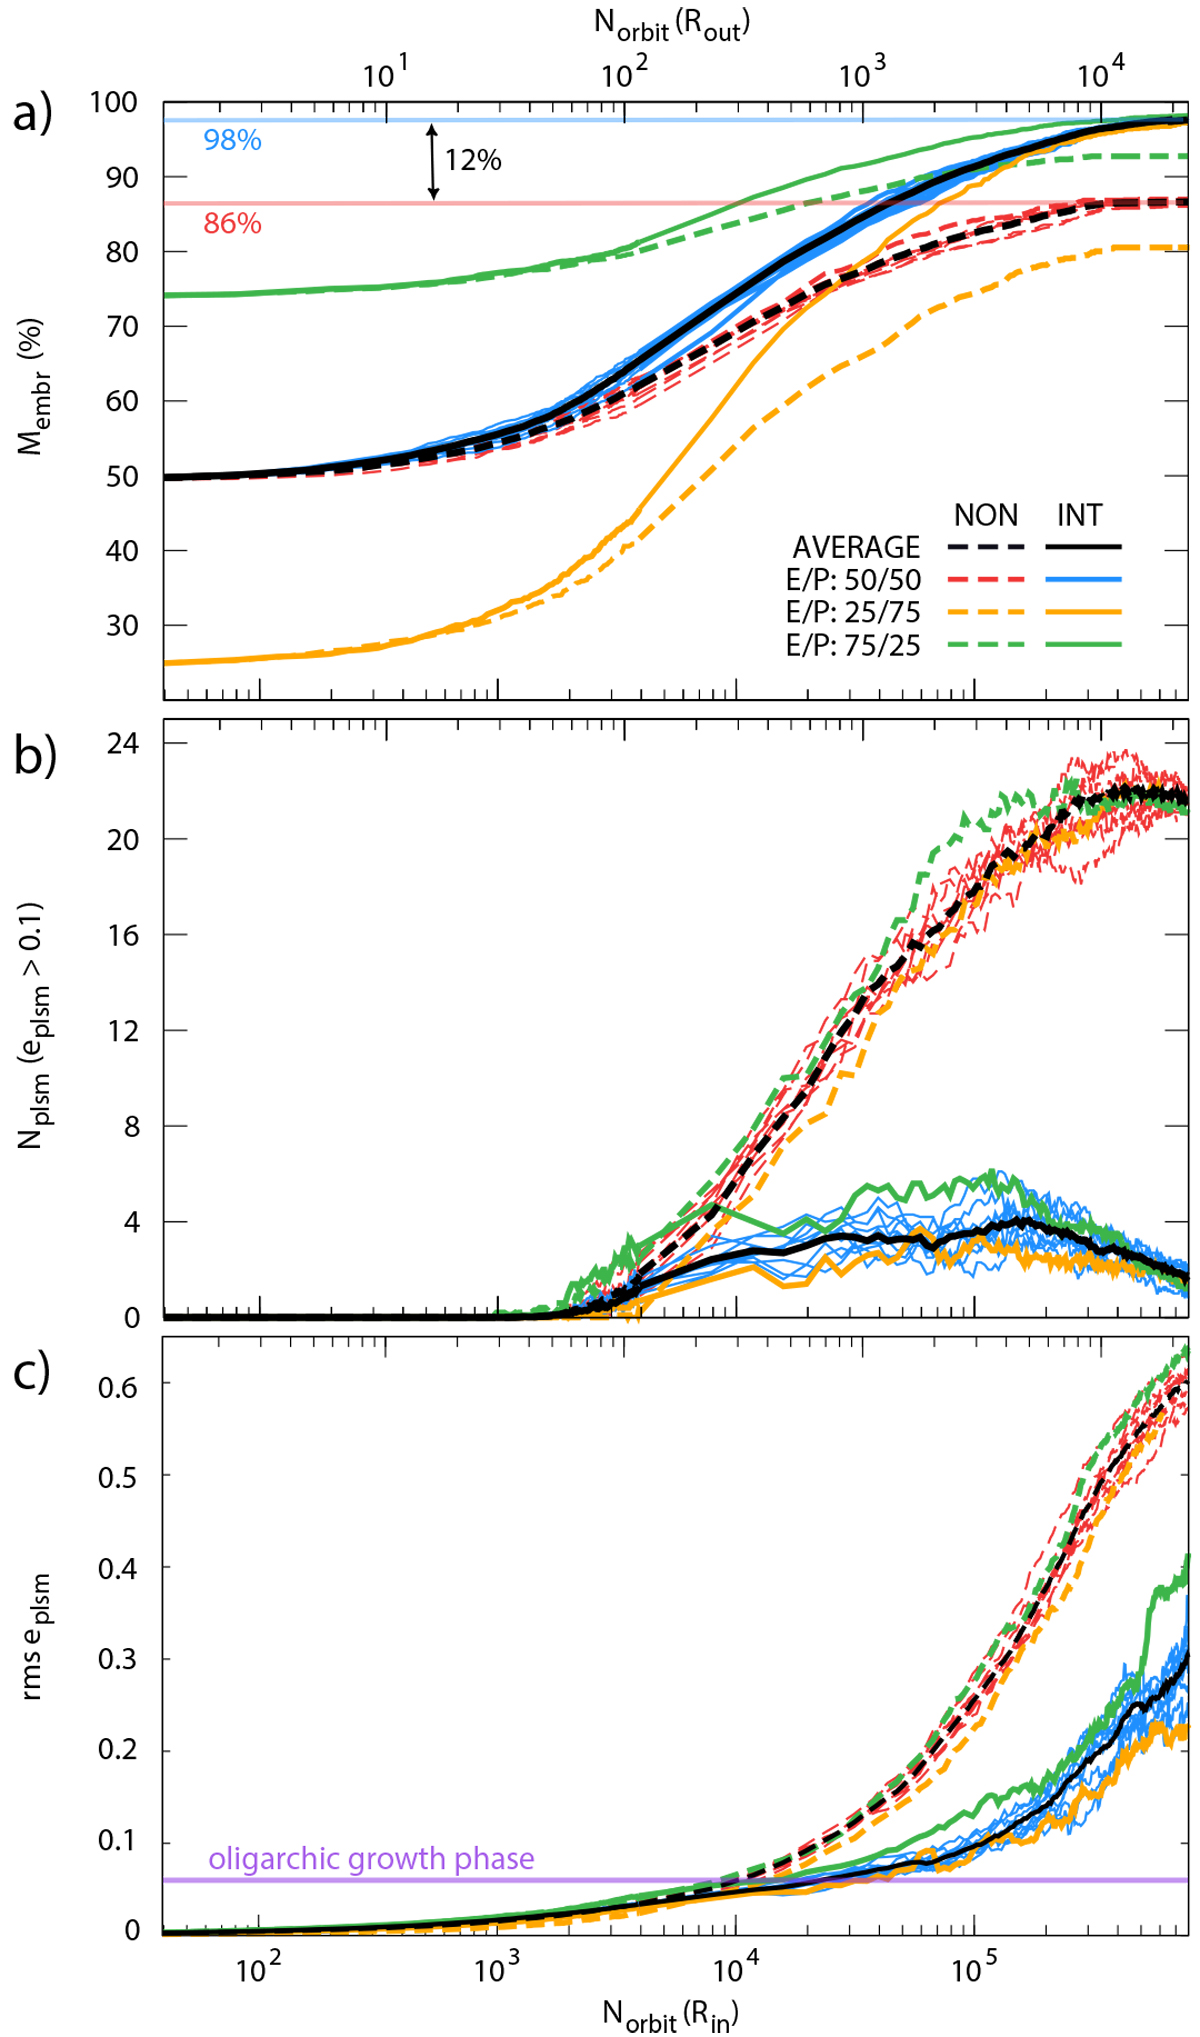
Evolution of the embryo-planetesimal belt. Panela: evolution of the total mass confined by accreting embryos. The mass is normalized by the initial mass of the embryo-planetesimal belt. The top and bottom horizontal axes display the number of orbits at the inner and the outer edges of the belt, respectively. Dashed red lines and solid blue lines show the mass evolution of the 50/50 mass ratio in the NON and INT models, respectively. Black lines show the average for 10–10 models in both cases. Orange and green lines indicate models where a 25/75 and a 75/25 initial embryo-to-planetesimal mass ratio is assumed, respectively. Panelb: evolution of the number of the HEP population normalized with the total number of planetesimals in all models. Panelc: evolution of the planetesimal rms eccentricity. Above the horizontal purple line, the system is in the oligarchic growth phase.
Current usage metrics show cumulative count of Article Views (full-text article views including HTML views, PDF and ePub downloads, according to the available data) and Abstracts Views on Vision4Press platform.
Data correspond to usage on the plateform after 2015. The current usage metrics is available 48-96 hours after online publication and is updated daily on week days.
Initial download of the metrics may take a while.