Fig. A.3.
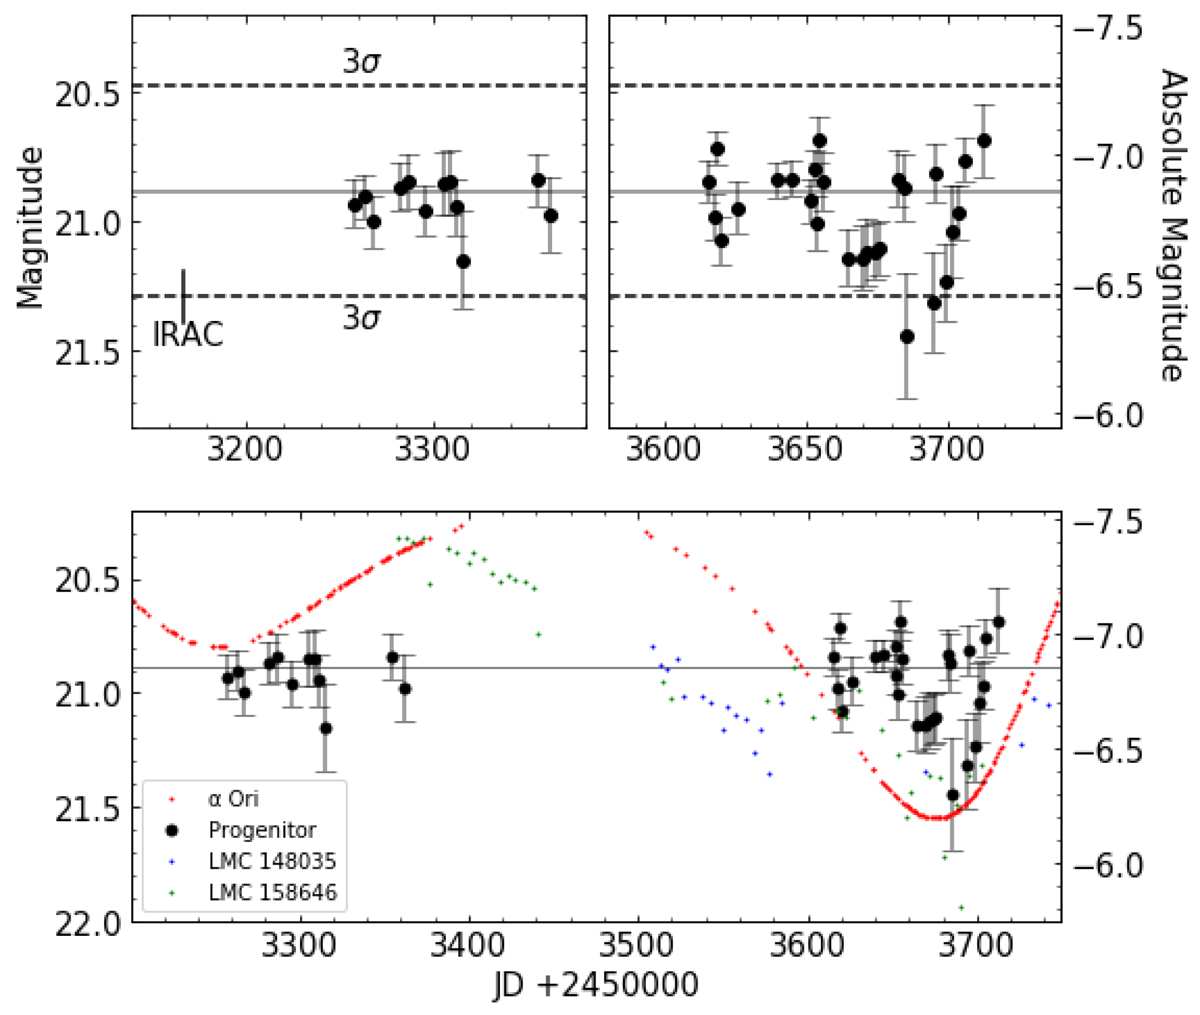
I band light curve of the progenitor of SN 2008bk. Top: the solid line denotes the weighted mean average magnitude for the dataset. The dashed lines represent the 3σ variation for the dataset. The values have only been corrected for Milky Way reddening. The vertical line shows the epochs at which the IRAC data were observed. Bottom: light curve of the progenitor alongside the light curves of three other RSG stars. The α Ori V-band light curve data were obtained from AAVSO (https://www.aavso.org/) while the V-band data for the LMC RSGs are from ASAS (http://www.astrouw.edu.pl/asas/?page=main). There are limited I-band data for the objects. The brightnesses of the sample RSGs are scaled such that the mean magnitude over the dataset is the same as that of the progenitor; they are also shifted in time such that the minimum in the light curve matches that of the progenitor. The progenitor of SN 2008bk does not show the slow variations displayed by well-known Galactic and other LMC RSGs.
Current usage metrics show cumulative count of Article Views (full-text article views including HTML views, PDF and ePub downloads, according to the available data) and Abstracts Views on Vision4Press platform.
Data correspond to usage on the plateform after 2015. The current usage metrics is available 48-96 hours after online publication and is updated daily on week days.
Initial download of the metrics may take a while.