Fig. A.1.
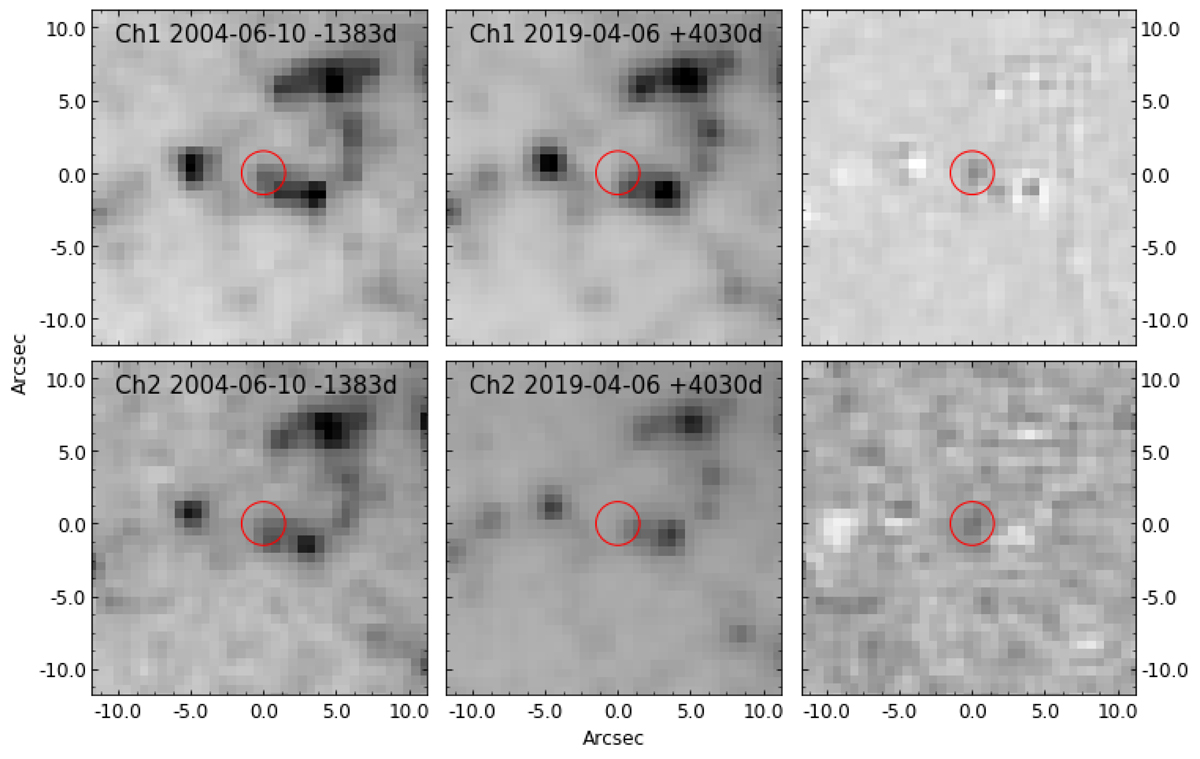
NIR IRAC images showing the detection of the progenitor. Left: pre-SN images showing the progenitor (red) circle in channels 1 (top) and 2 (bottom). Middle: post-explosion images in channels 1 and 2. Right: difference images (post-explosion − pre-explosion image). There is a source visible at the progenitor position in both channels. We detect it with an S/N of ∼10 (≫3σ) in channel 1, and an S/N of ∼4 (∼3σ) in channel 2.
Current usage metrics show cumulative count of Article Views (full-text article views including HTML views, PDF and ePub downloads, according to the available data) and Abstracts Views on Vision4Press platform.
Data correspond to usage on the plateform after 2015. The current usage metrics is available 48-96 hours after online publication and is updated daily on week days.
Initial download of the metrics may take a while.