Fig. 3.
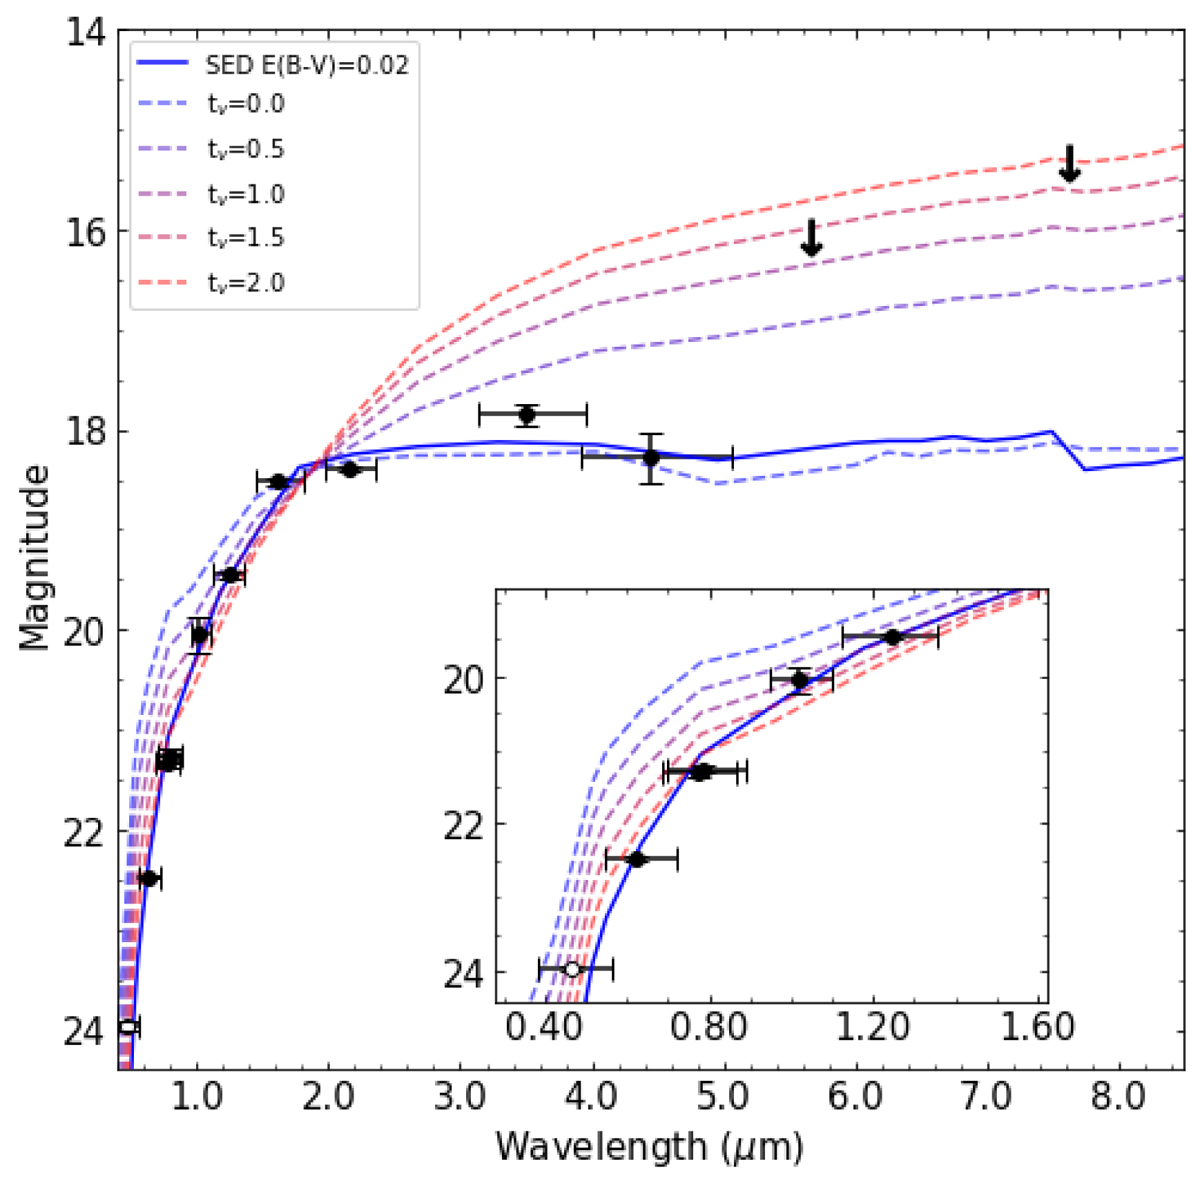
Output from the DUSTY models showing the hotter (T = 4500 K) MARCS model with various amounts of CSM reddening (dashed lines) scaled to match the H and Ks bands. Also shown is the best fitting, cooler (T = 3500 K, E(B − V) = 0.02) model (solid line). Both have been re-binned to match the wavelength grid of the DUSTY models. The inset shows zoomed-in view of the optical region only; the open circle denotes the g-band point. It is immediately apparent that the mid-IR data are only consistent with low extinction. The low-extinction, high-temperature SED is too blue and does not match the optical data, while the high-extinction, high-temperature SED results in mid-IR emission that is too bright compared to the data.
Current usage metrics show cumulative count of Article Views (full-text article views including HTML views, PDF and ePub downloads, according to the available data) and Abstracts Views on Vision4Press platform.
Data correspond to usage on the plateform after 2015. The current usage metrics is available 48-96 hours after online publication and is updated daily on week days.
Initial download of the metrics may take a while.