Fig. 2.
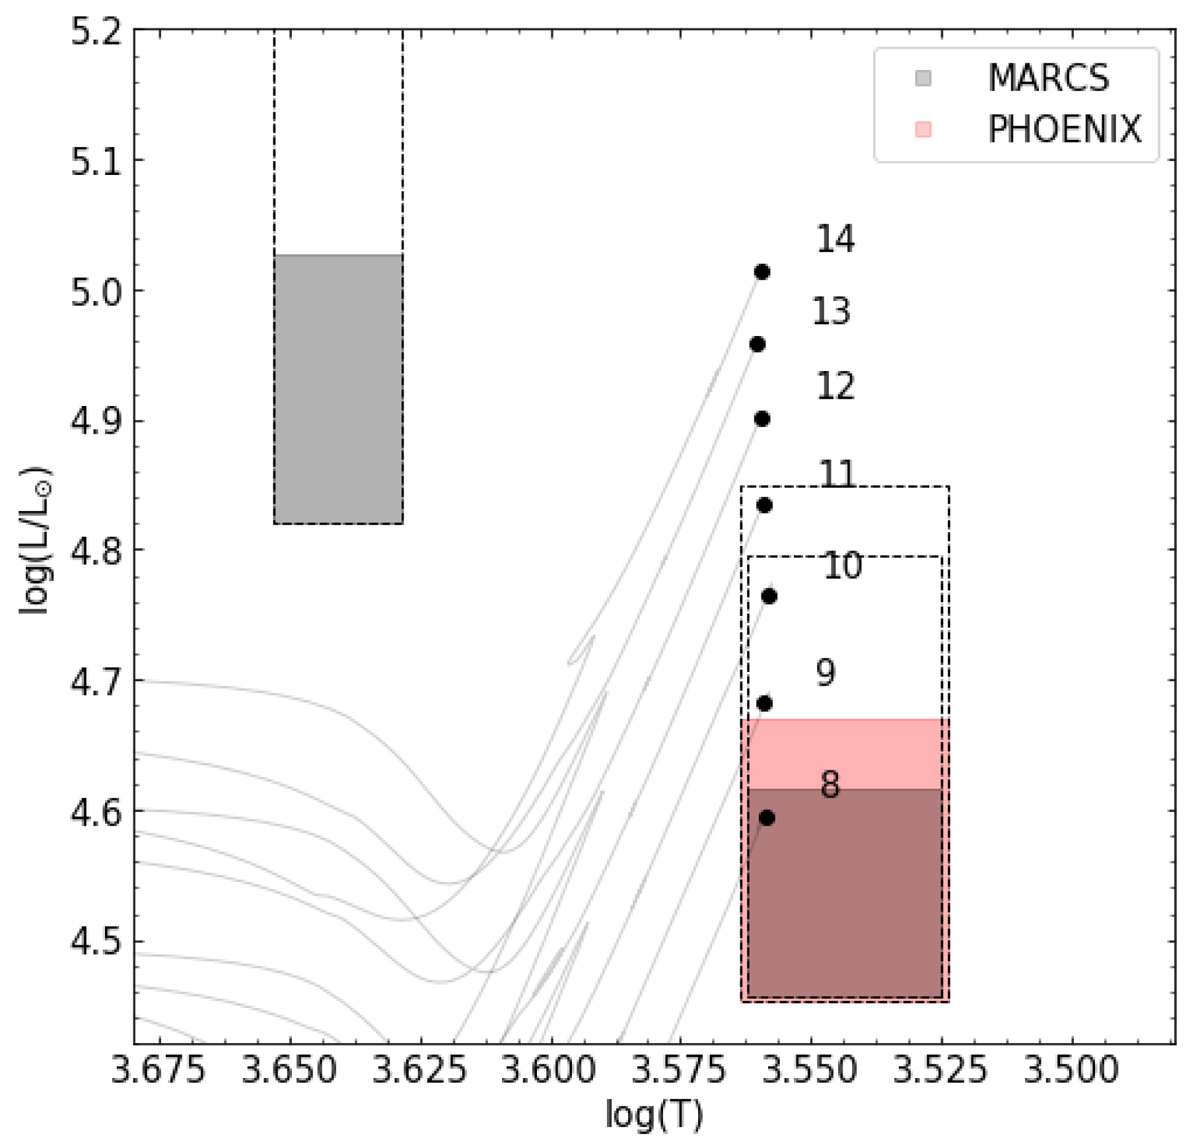
Comparison between stellar evolution tracks and the allowed regions as inferred from the observations. Shown are the stellar evolution tracks of 8 ≤ MZAMS/M⊙ ≤ 14 for subsolar metallicity (log(Z/Z⊙) = − 0.4). The results from this study are depicted by boxes that show the allowed ranges in temperature and luminosity for the progenitor given the uncertainties. The grey and red shaded regions show the luminosity ranges estimated using the SEDs of the MARCS and PHOENIX models, respectively, and assuming the shorter (Cepheid and TRGB) distance of 3.5 ± 0.1 Mpc for our two best model matches (Sect. 3). The dashed lines extend the boxes to show the effect of considering the full distance range (3.32−4.32 Mpc).
Current usage metrics show cumulative count of Article Views (full-text article views including HTML views, PDF and ePub downloads, according to the available data) and Abstracts Views on Vision4Press platform.
Data correspond to usage on the plateform after 2015. The current usage metrics is available 48-96 hours after online publication and is updated daily on week days.
Initial download of the metrics may take a while.