Fig. 1.
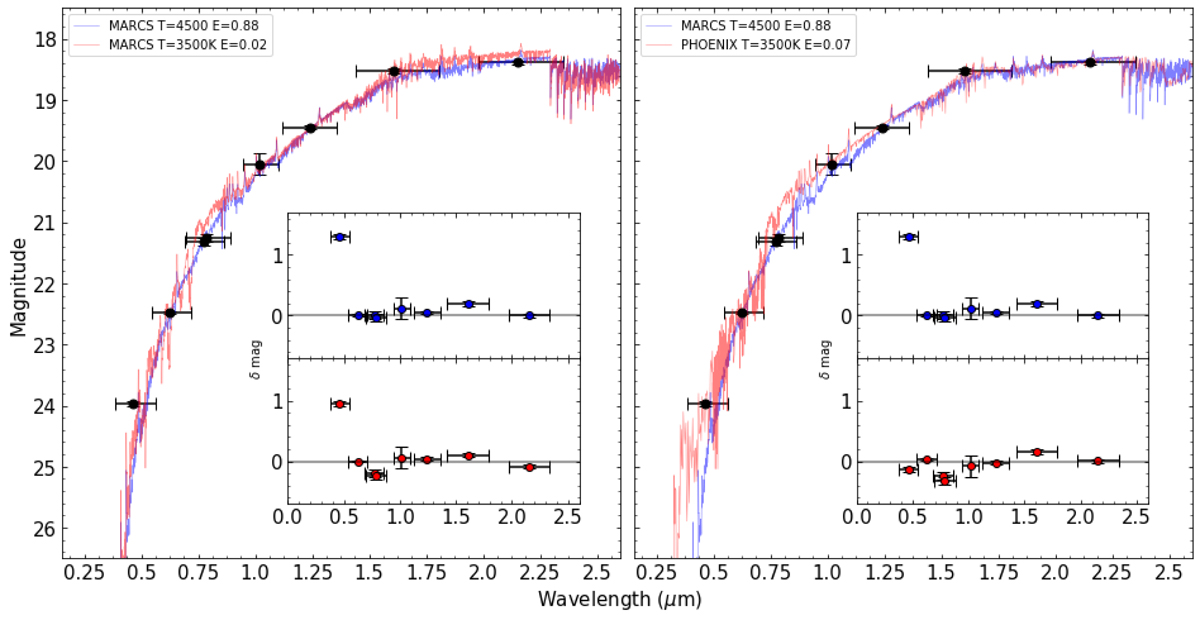
Left: comparison between the two best fitting MARCS models. Black points mark the photometric points from the progenitor. The horizontal uncertainties simply denote the width of the photometric band. Inset are the residuals between the photometry and the SEDs for both fits. We note the large disagreement between the SEDs and the g′ band point at 0.46 μm. Right: comparison between the high temperature, high extinction MARCS model and the best fitting PHOENIX model. The PHOENIX model appears to fit the blue g′ band much better, however it overestimates the flux in the optical >6500 Å. The mid-IR points (Table A.1) are not shown here for clarity and ease of comparison with previous studies.
Current usage metrics show cumulative count of Article Views (full-text article views including HTML views, PDF and ePub downloads, according to the available data) and Abstracts Views on Vision4Press platform.
Data correspond to usage on the plateform after 2015. The current usage metrics is available 48-96 hours after online publication and is updated daily on week days.
Initial download of the metrics may take a while.