Fig. 8
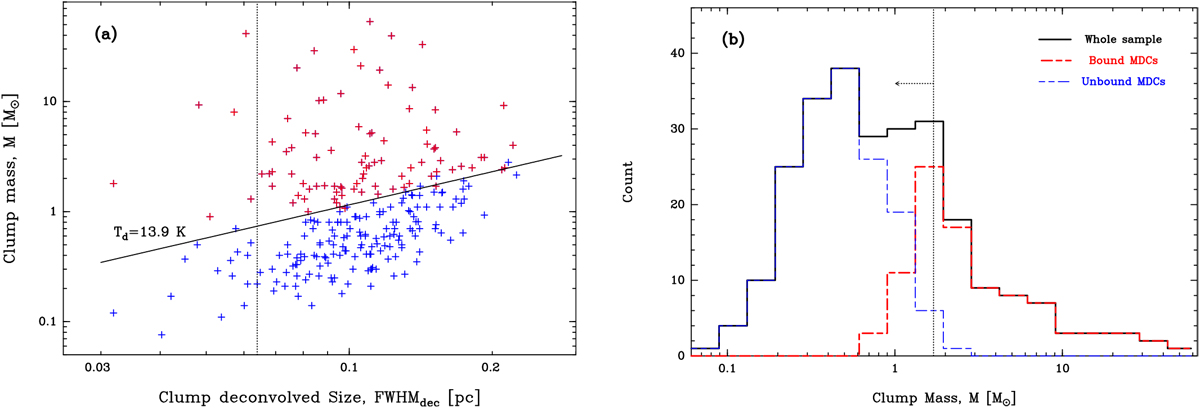
Mass vs. size diagram (panel a) and mass distribution (panel b) for the 256 clumps detected in the NGC 2264 cloud. Gravitationally bound and unbound clumps, with αBE < 2 and αBE ≥ 2, respectively are located with red (resp. blue) markers (panel a) and sum up in a red (resp. blue) histogram (panel b). Panel a: the critical Bonnor-Ebert sphere model (αBE = 2) at the median clump temperature, Tdust = 13.9 K, is plotted asa black solid line. The physical size of the beam at a distance of 723 pc is plotted as a vertical doted line. Panel b: theglobal 90% completeness level is indicated with a doted line.
Current usage metrics show cumulative count of Article Views (full-text article views including HTML views, PDF and ePub downloads, according to the available data) and Abstracts Views on Vision4Press platform.
Data correspond to usage on the plateform after 2015. The current usage metrics is available 48-96 hours after online publication and is updated daily on week days.
Initial download of the metrics may take a while.