Fig. 7
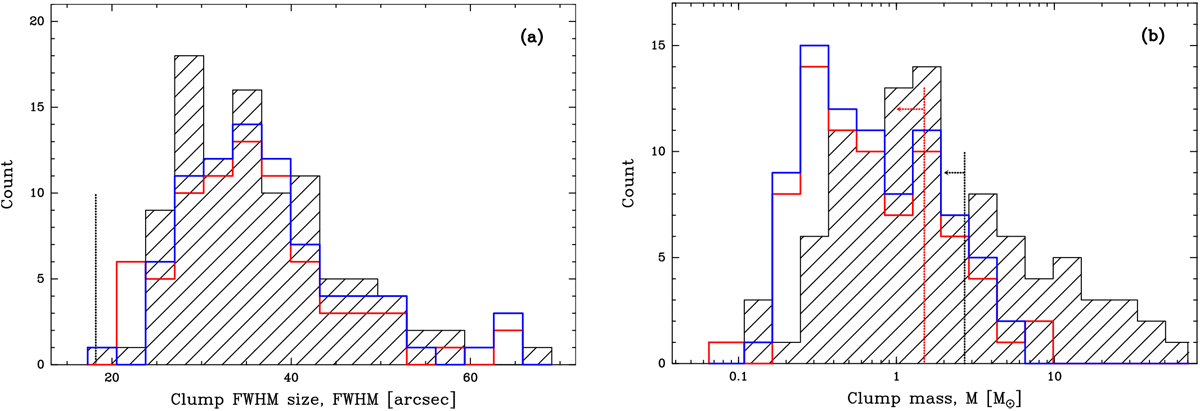
Distribution of clump size (panel a) and clump mass (panel b) for the three subregions of NGC 2264: central (hatched black histograms), northern (red histograms), and southern (blue histograms) subregions. The central subregion has an excess of high-mass clumps comparedthe northern and southern subregions. The angular resolution of our observations, 18.2′′, is given in panel a. The completeness levels, ~2.7 M⊙ in the central subregion and ~1.5 M⊙ in the northern and southern subregions, are indicated in panel b with dotted lines.
Current usage metrics show cumulative count of Article Views (full-text article views including HTML views, PDF and ePub downloads, according to the available data) and Abstracts Views on Vision4Press platform.
Data correspond to usage on the plateform after 2015. The current usage metrics is available 48-96 hours after online publication and is updated daily on week days.
Initial download of the metrics may take a while.