Fig. 5
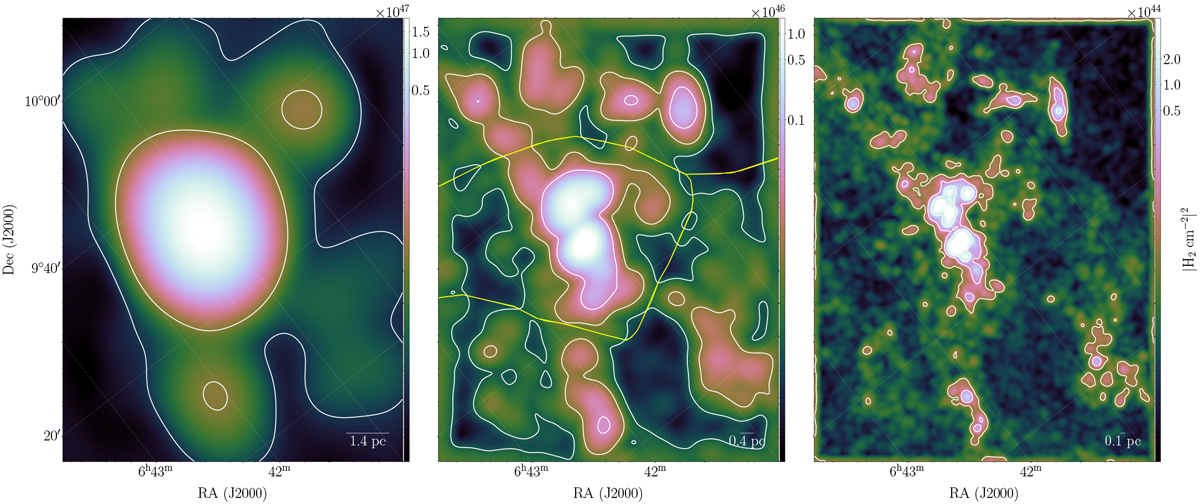
Power density fluctuations of NGC 2264 measured by MnGSeg and averaged over θ for three scales: 0.15 arcmin−1 (or 1.4 pc, left panel), 0.47 arcmin−1 (or 0.4 pc, middle panel), and 1.5 arcmin−1 (or 0.1 pc, right panel). Images are rotated from the RA-Dec grid (gray lines) to facilitate the wavelet decomposition. The yellow lines in the middle panel separate the three subregions of NGC 2264.
Current usage metrics show cumulative count of Article Views (full-text article views including HTML views, PDF and ePub downloads, according to the available data) and Abstracts Views on Vision4Press platform.
Data correspond to usage on the plateform after 2015. The current usage metrics is available 48-96 hours after online publication and is updated daily on week days.
Initial download of the metrics may take a while.