Fig. 4
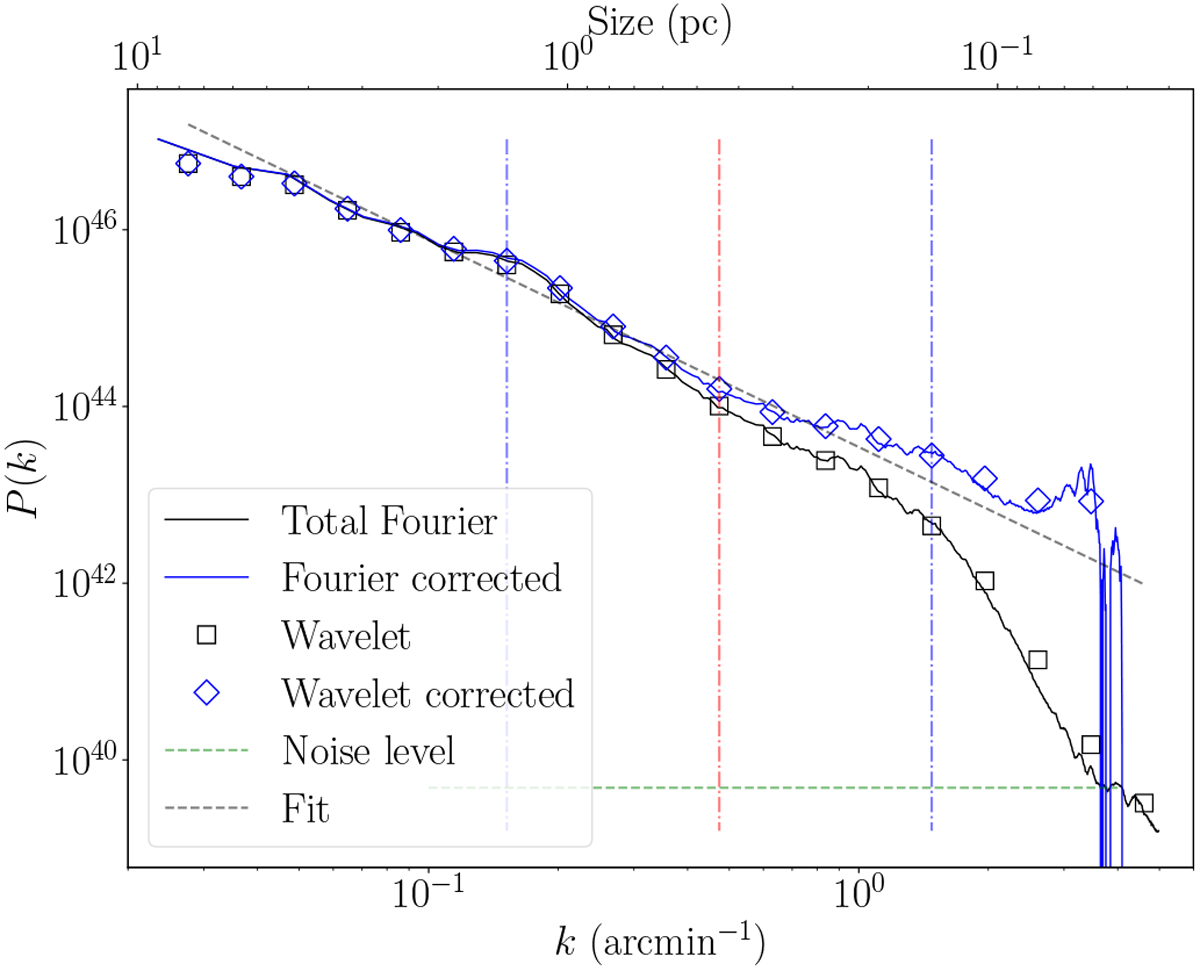
Fourier (solid lines) and wavelet (symbols) power spectra of the NGC 2264 region. Before fitting a P(k) =A kγ relation (dashed curve), the corrected power spectra are subtracted by the noise level (plateau at the end of the original power spectrum, dotted horizontal green line) and divided by the empirical SPIRE 250 μm beam. The power spectra present two bumps, located at 1.4 and 0.1 pc (dot-dashed vertical blue lines). The intermediate scale chosento separate the three NGC 2264 subregions is indicated by a dot-dashed vertical red line.
Current usage metrics show cumulative count of Article Views (full-text article views including HTML views, PDF and ePub downloads, according to the available data) and Abstracts Views on Vision4Press platform.
Data correspond to usage on the plateform after 2015. The current usage metrics is available 48-96 hours after online publication and is updated daily on week days.
Initial download of the metrics may take a while.