Fig. 2
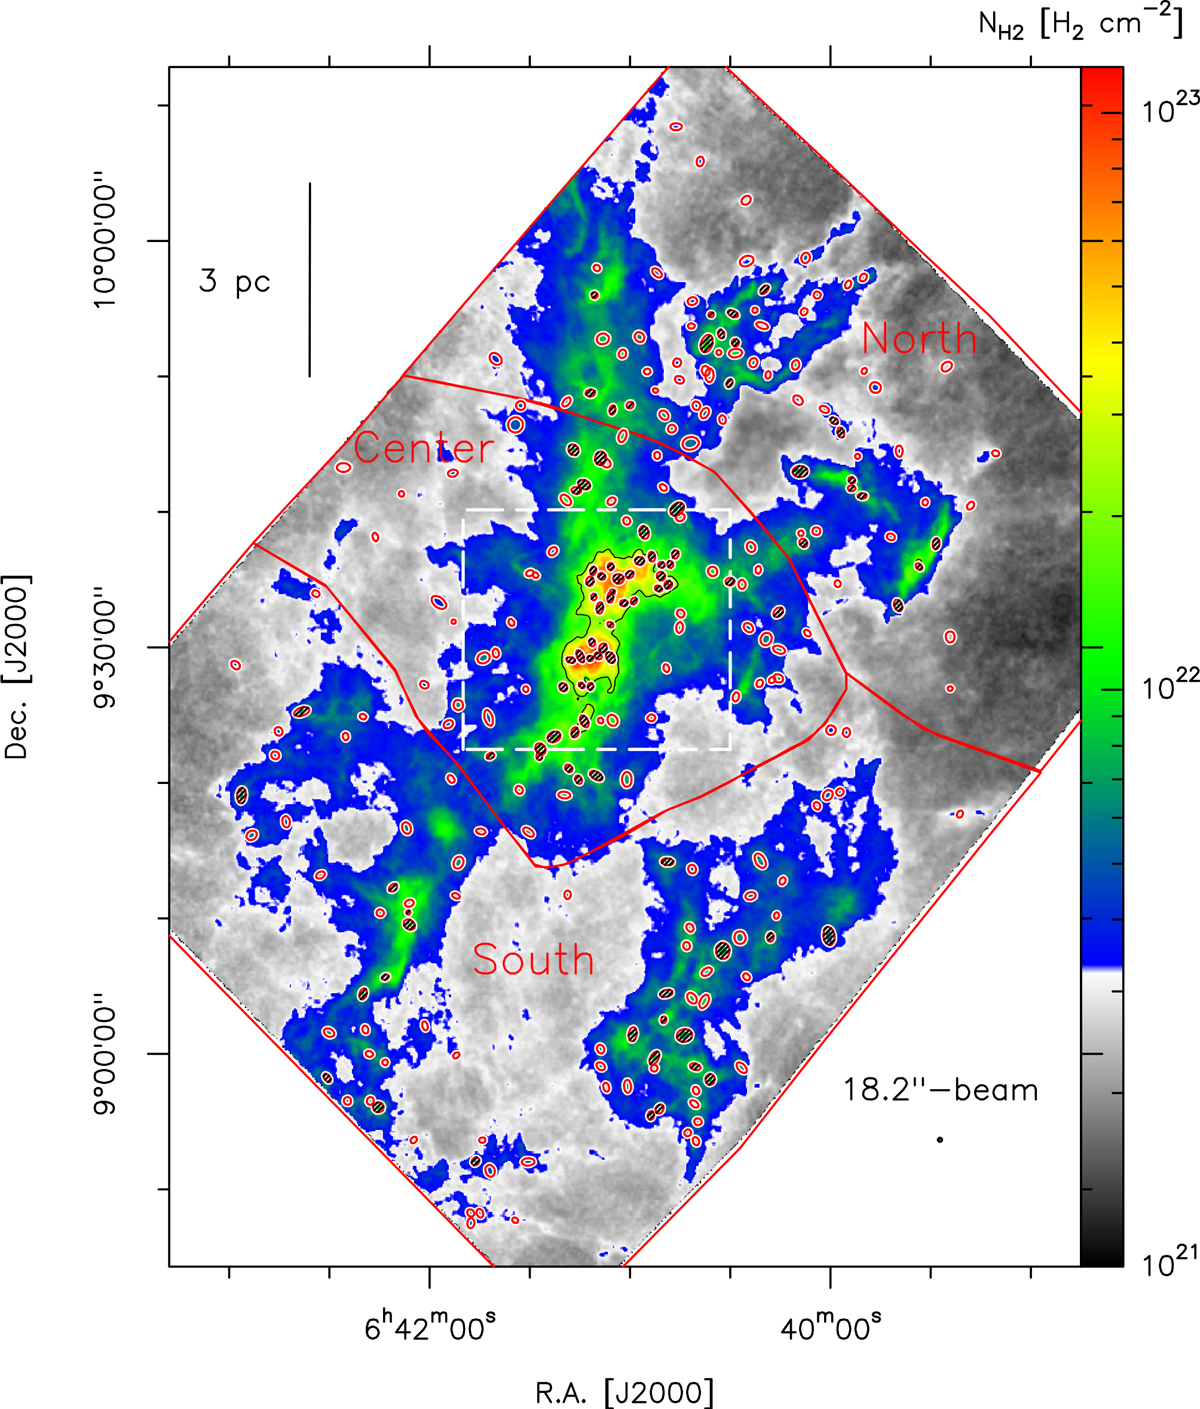
NGC 2264 cloud traced by its Herschel column density. The clumps extracted by getsf are indicated by hatched ellipses for gravitationally bound clumps and open ellipses empty for unbound clumps. The contour at 2 × 1022 cm−2 highlights the brightest parts. The resolution of the map, 18.2′′, is shown in the lower right corner and a scale bar is given in the upper left corner. The outline and labels of the three subregions defined in Sect. 3.1 and used in the analysis are shown in red. The location of the zoom of Fig. 3 is shown with a white box.
Current usage metrics show cumulative count of Article Views (full-text article views including HTML views, PDF and ePub downloads, according to the available data) and Abstracts Views on Vision4Press platform.
Data correspond to usage on the plateform after 2015. The current usage metrics is available 48-96 hours after online publication and is updated daily on week days.
Initial download of the metrics may take a while.