Fig. A.3
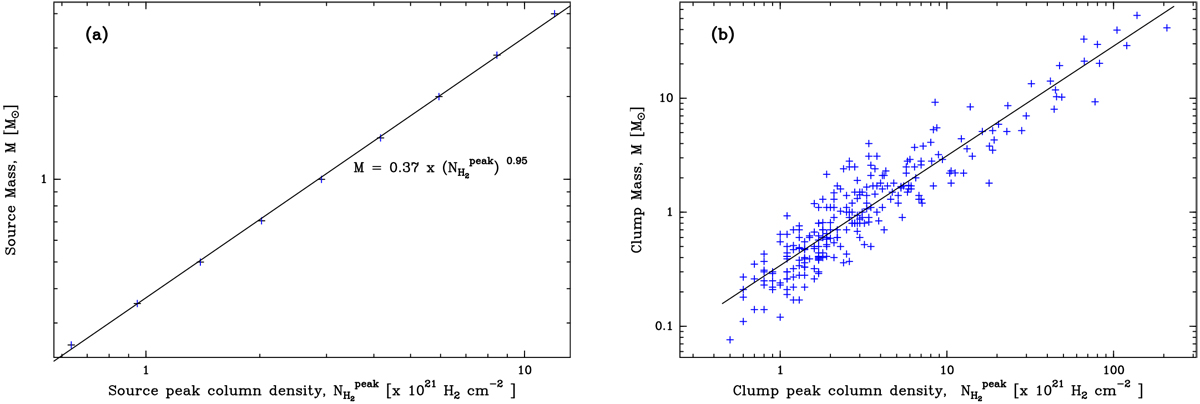
Mass as a function of peak column density for synthetic sources (panel a) and for observed clumps (panel b). A simple regression gives the relation ![]() with β = 0.37 in panel a over a [0.6 − 12 × 1021 cm−2] range, β = 0.34 in panel b over a [0.5 − 200 × 1021 cm−2]. The similarity in the fitted parameters confirms that the synthetic sources correctly represent the observed clumps.
with β = 0.37 in panel a over a [0.6 − 12 × 1021 cm−2] range, β = 0.34 in panel b over a [0.5 − 200 × 1021 cm−2]. The similarity in the fitted parameters confirms that the synthetic sources correctly represent the observed clumps.
Current usage metrics show cumulative count of Article Views (full-text article views including HTML views, PDF and ePub downloads, according to the available data) and Abstracts Views on Vision4Press platform.
Data correspond to usage on the plateform after 2015. The current usage metrics is available 48-96 hours after online publication and is updated daily on week days.
Initial download of the metrics may take a while.