Fig. A.2
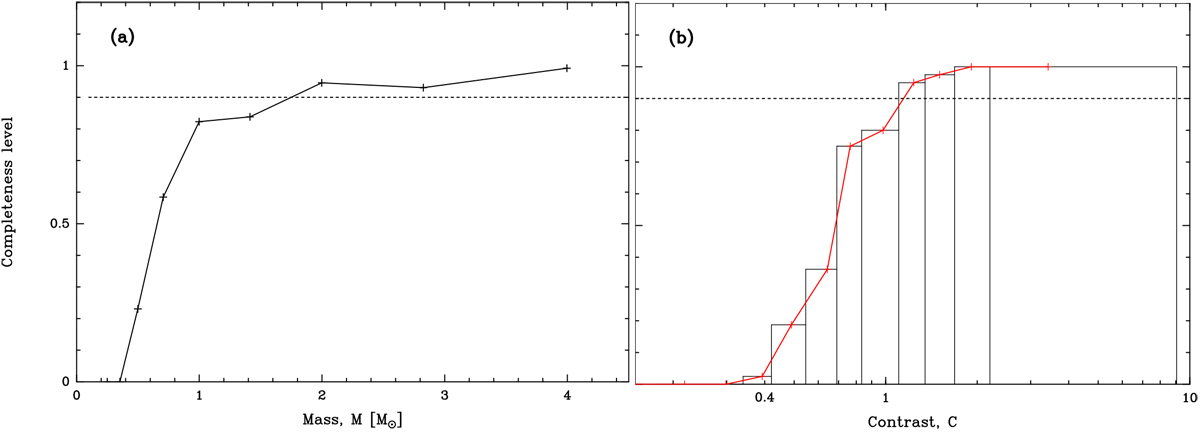
Completeness level of the clumps extraction as a function of the clump mass (panel a) and of the contrast of the clump column density over its local background (panel b). The 90% completeness level is indicated with a dashed horizontal line. Panel a: the clump sample is 90% complete above 1.7 M⊙. Panel b: thehistogram has been constructed with a constant number of 80 synthetic sources in the 11 first bins, plus a bin containing the remaining 290 sources that have all been detected. The red curve connects the median contrast value in each bin. Of the clumps, 90% are detected for a contrast larger than 1.1.
Current usage metrics show cumulative count of Article Views (full-text article views including HTML views, PDF and ePub downloads, according to the available data) and Abstracts Views on Vision4Press platform.
Data correspond to usage on the plateform after 2015. The current usage metrics is available 48-96 hours after online publication and is updated daily on week days.
Initial download of the metrics may take a while.