Fig. 14
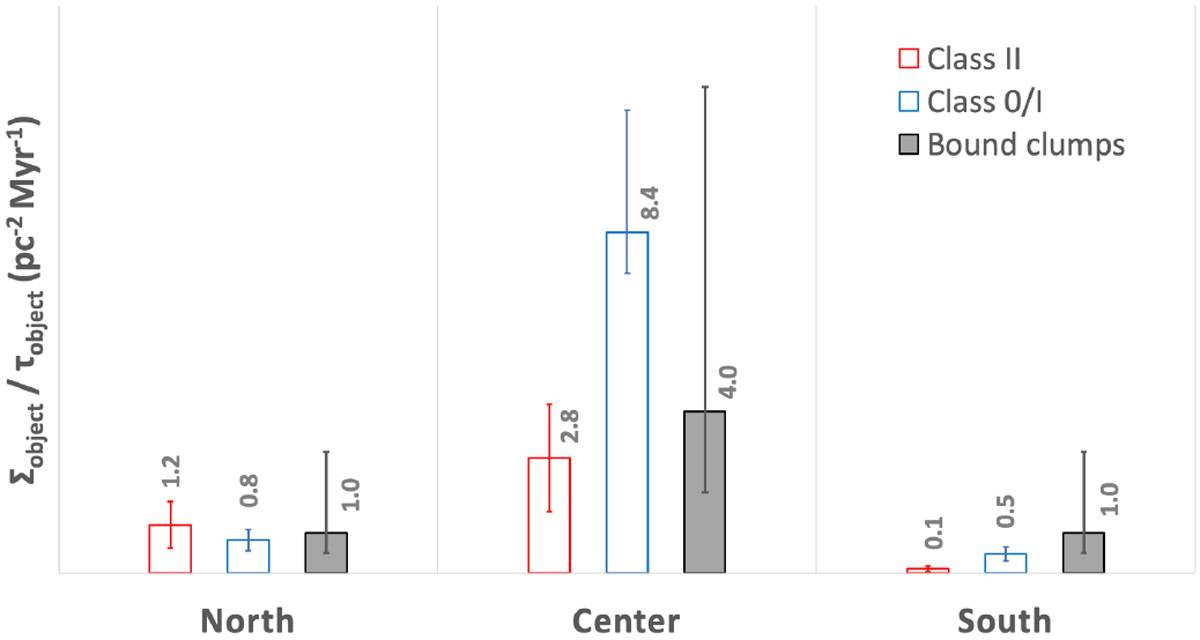
Surface density per lifetime, Σobject∕τobject, of Class II YSOs, Class 0/I protostars, and clumps in the three NGC 2264 subregions. Statistical lifetimes of 2, 0.2, and 0.3 Myr were assumed for Class IIs, Class 0/Is, and clumps, respectively. Error bars take into account statistical uncertainties, contamination level of 30% for Class IIs, an incompleteness level of 25% for the Class 0/I population in the central subregion, and a factor of two of uncertainty for the clumps. While the star formation activity of the northern subregion appears to be constant, it displays a burst in the central subregion and shows a tentative increase in the southern subregion.
Current usage metrics show cumulative count of Article Views (full-text article views including HTML views, PDF and ePub downloads, according to the available data) and Abstracts Views on Vision4Press platform.
Data correspond to usage on the plateform after 2015. The current usage metrics is available 48-96 hours after online publication and is updated daily on week days.
Initial download of the metrics may take a while.