Fig. 13
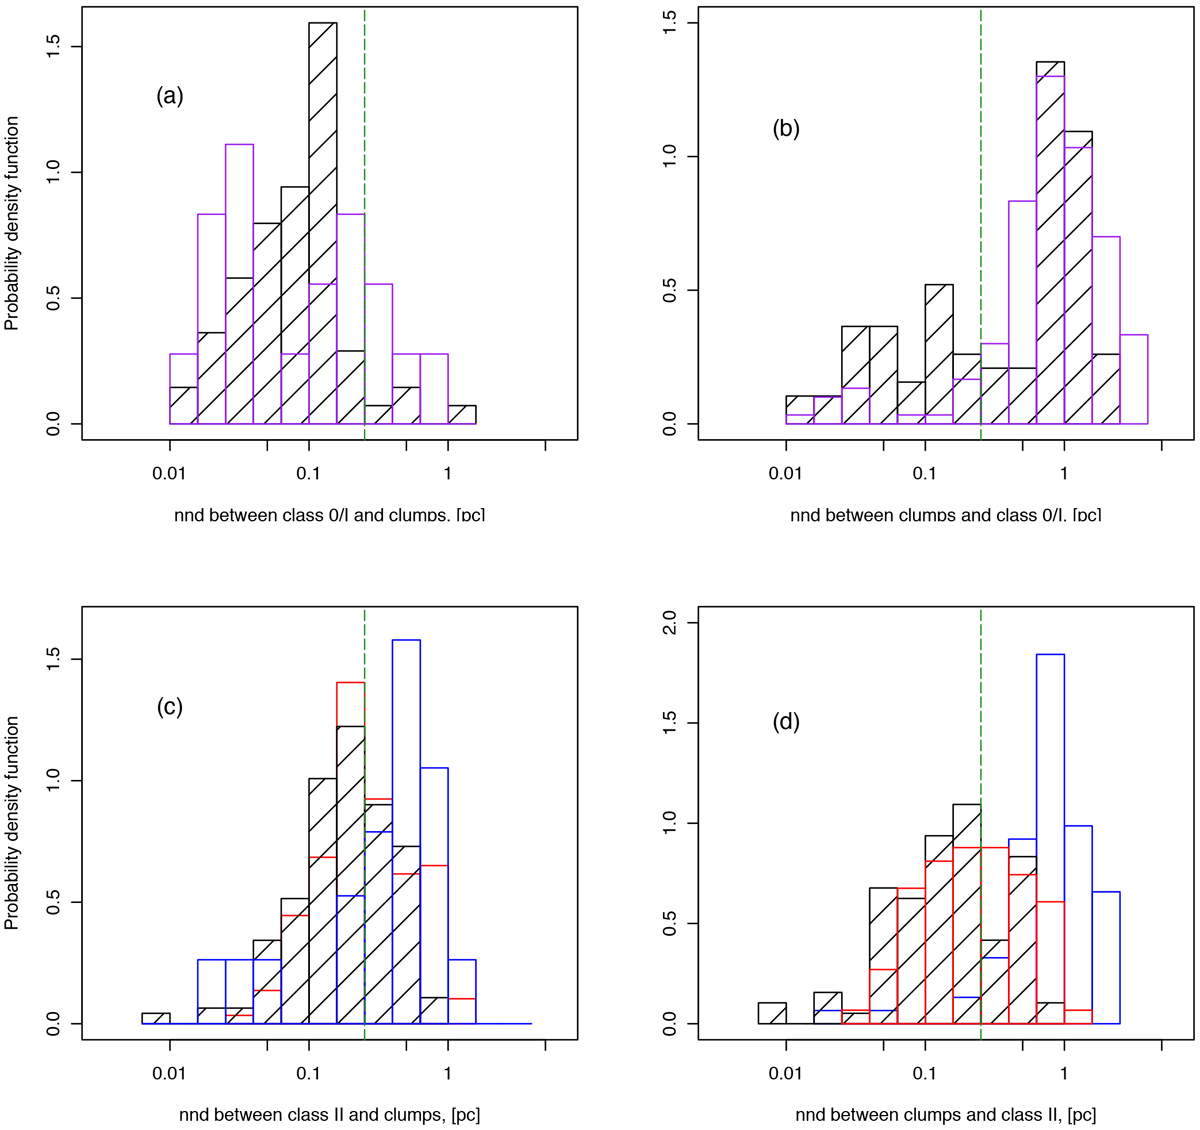
Distribution of the distance to the first nearest neighbor, nnd, from YSOs to clumps (panels a and c) and from clumps to YSOs (panels b and d). The YSOs are Class 0/I in the upper panels (a and b), Class II in the lower panels (c and d). Distributions are presented for the central subregion (hatched black histograms) and for the northern and southern subregions, combined in the upper panel (purple histogram) and separated in the lower panel (red and blue histograms, respectively). Distributions are normalized to facilitate the comparison involving small populations of YSOs (Class 0/I from northern and southern subregions in panel a, Class II from southern subregions in panel c). The dashedvertical red line indicates the median outer radius of clumps, calculated as twice the median FWHM: ![]() pc.
pc.
Current usage metrics show cumulative count of Article Views (full-text article views including HTML views, PDF and ePub downloads, according to the available data) and Abstracts Views on Vision4Press platform.
Data correspond to usage on the plateform after 2015. The current usage metrics is available 48-96 hours after online publication and is updated daily on week days.
Initial download of the metrics may take a while.