Fig. 11
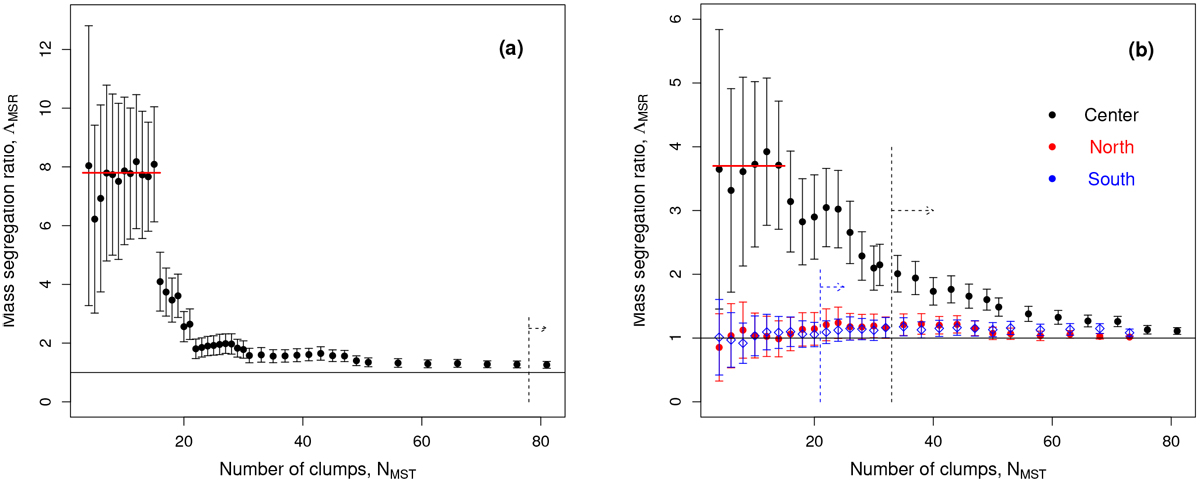
Masssegregation ratio, ΛMSR, as a functionof the numbers of clumps, NMST, in the NGC 2264 cloud (panel a) and in its three subregions (panel b). Error bars represent the ± 2σ uncertainties. Values above ΛMSR ≃ 1 (black solid line) suggest mass segregation. Completeness levels are indicated with vertical dashed lines. Panel a: median segregation ratio for the 15 most massive clumps of NGC 2264, calculated over NMST= 4 to 15, is ![]() (red segment). Panel b: the ΛMSR function of clumps in the central subregion (black symbols) is three to two times higher than that in the northern and southern subregions (in red and blue, respectively) over the range of NMST= 4−33.
(red segment). Panel b: the ΛMSR function of clumps in the central subregion (black symbols) is three to two times higher than that in the northern and southern subregions (in red and blue, respectively) over the range of NMST= 4−33.
Current usage metrics show cumulative count of Article Views (full-text article views including HTML views, PDF and ePub downloads, according to the available data) and Abstracts Views on Vision4Press platform.
Data correspond to usage on the plateform after 2015. The current usage metrics is available 48-96 hours after online publication and is updated daily on week days.
Initial download of the metrics may take a while.