Fig. 10
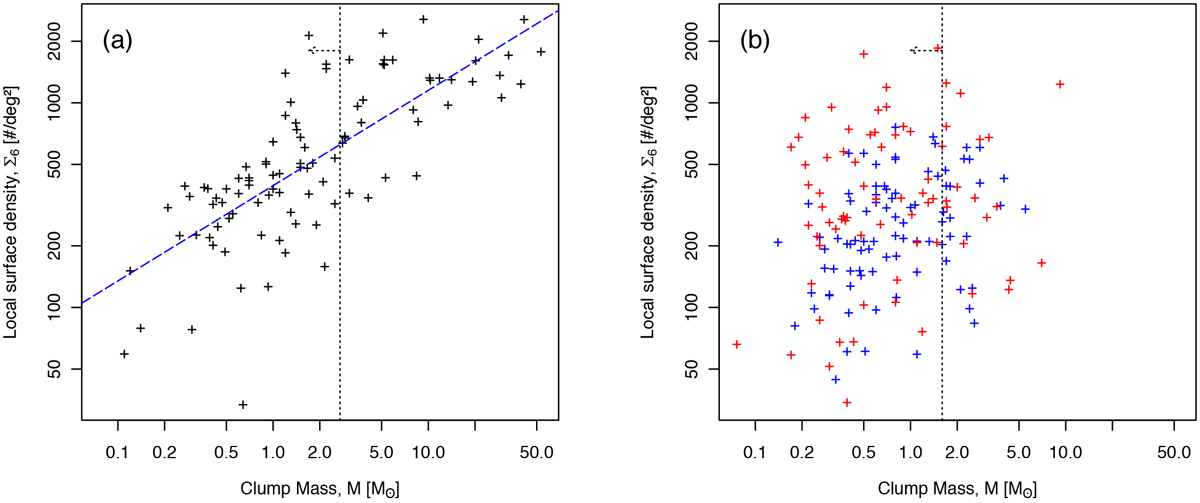
Local surface density Σ6 as a function of the mass of the clump for the central subregion of NGC 2264 (panel a, black markers) and in the northern and southern subregions (panel b, red and blue markers, respectively). The potential correlation between Σ6 and M in a, Σ6∝ M0.47 is represented by a dashed blue line in both panels a and b. Completeness levels are indicated by dotted vertical lines.
Current usage metrics show cumulative count of Article Views (full-text article views including HTML views, PDF and ePub downloads, according to the available data) and Abstracts Views on Vision4Press platform.
Data correspond to usage on the plateform after 2015. The current usage metrics is available 48-96 hours after online publication and is updated daily on week days.
Initial download of the metrics may take a while.