Fig. 9
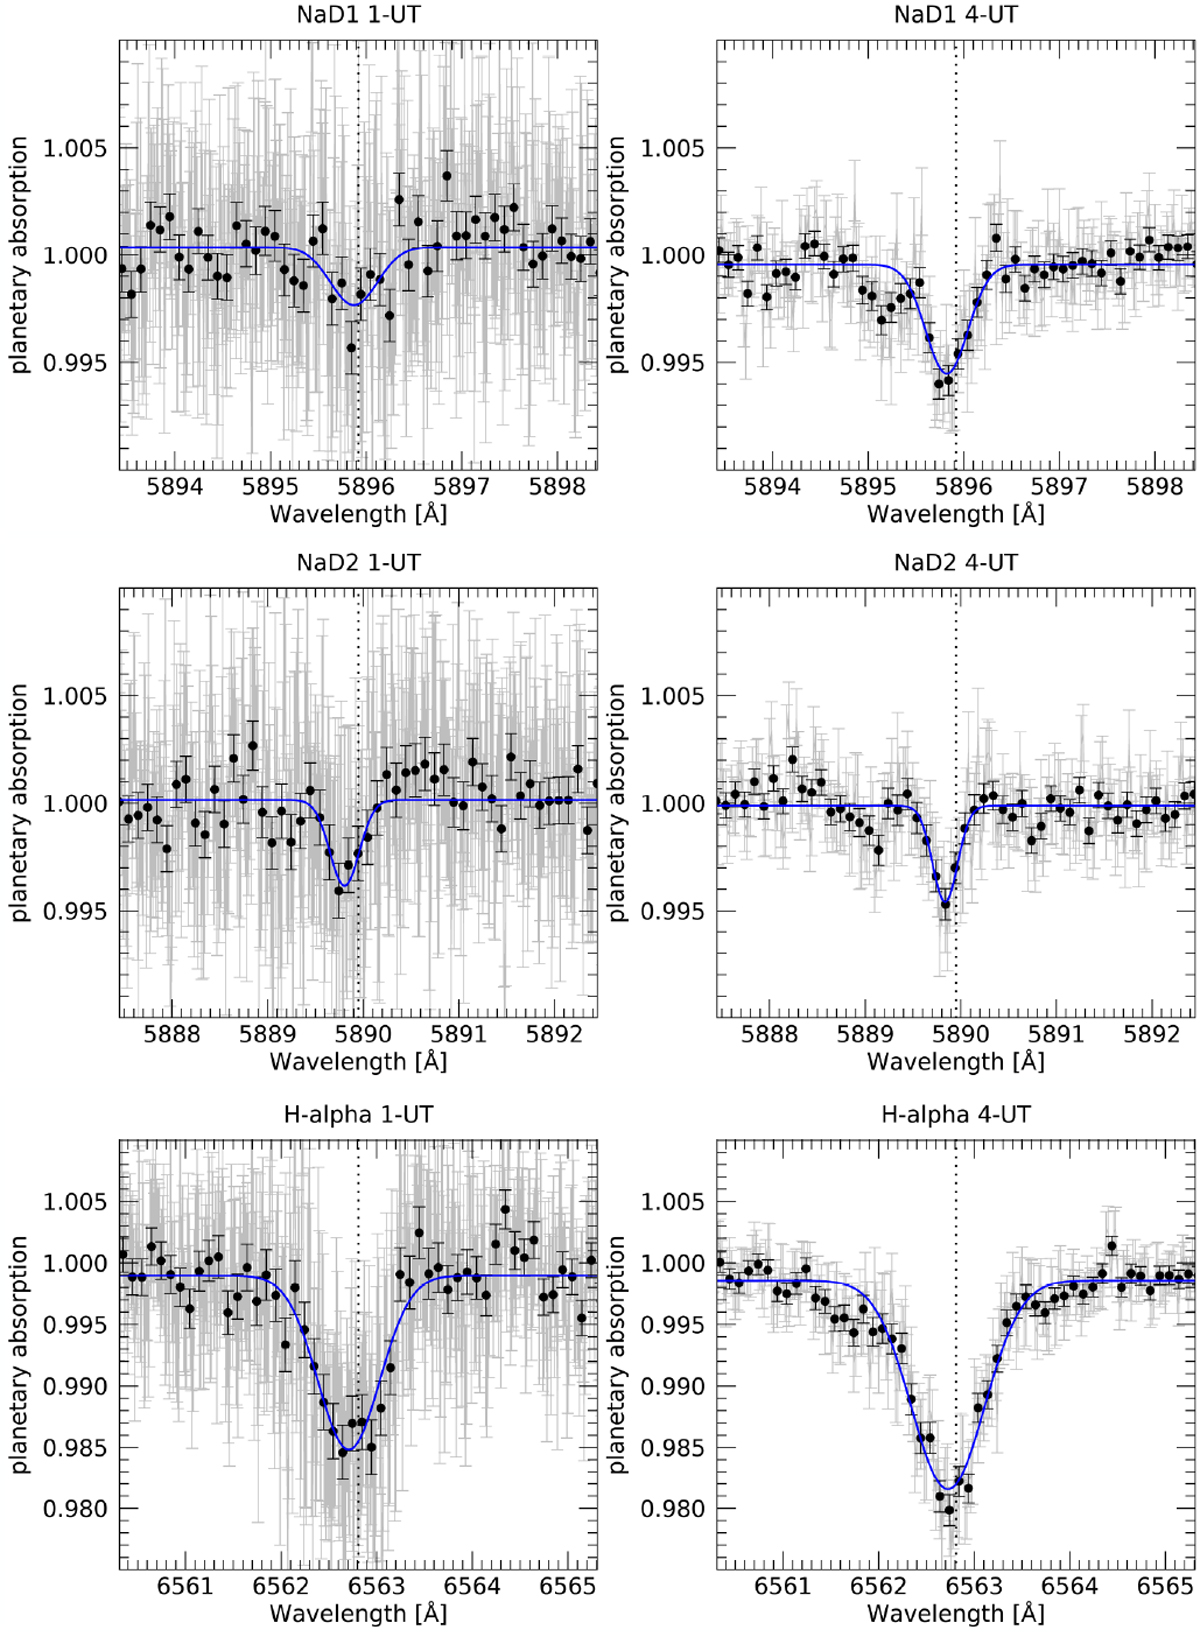
Detections of Na D1 (first row), Na D2 (second row), and Hα (third row) for the transits observed with 1-UT (first column) and 4-UT (second column). The vertical scale is the same for each row, showing the precision of the 4-UT data. The black points represent 0.1 Å binning; theblue line is the best fit Gaussian profile. The vertical dotted line shows the expected planetary restframe.
Current usage metrics show cumulative count of Article Views (full-text article views including HTML views, PDF and ePub downloads, according to the available data) and Abstracts Views on Vision4Press platform.
Data correspond to usage on the plateform after 2015. The current usage metrics is available 48-96 hours after online publication and is updated daily on week days.
Initial download of the metrics may take a while.