Free Access
Fig. 7
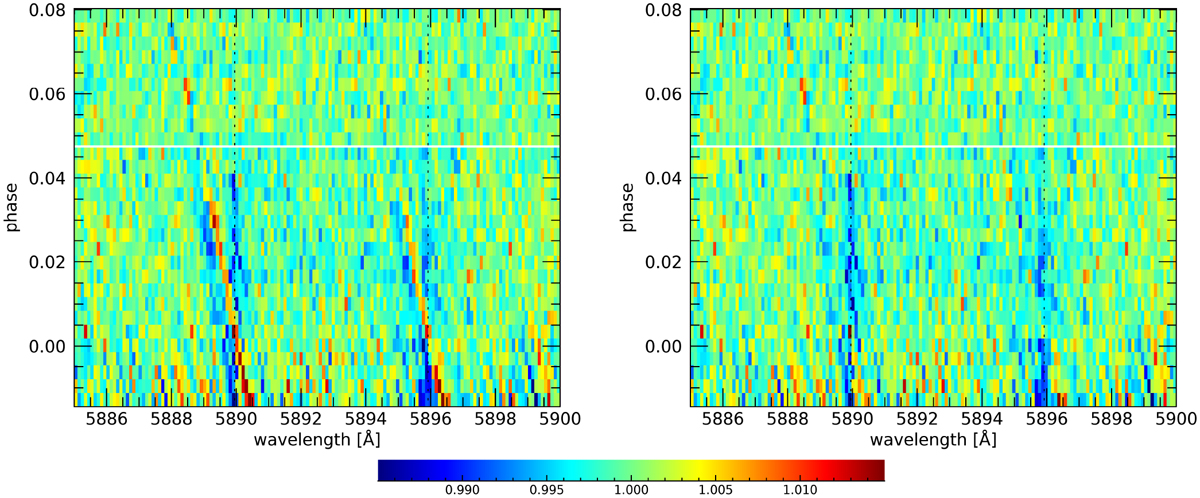
Tomographic map of the sodium D doublet in the planetary restframe for the 4-UT transit, shown before (left panel) and after (right panel) the correction for the CLV and RM effects. The horizontal white line shows the end of the transit; the vertical dashed lines represent the planetary restframe of the sodium D lines.
Current usage metrics show cumulative count of Article Views (full-text article views including HTML views, PDF and ePub downloads, according to the available data) and Abstracts Views on Vision4Press platform.
Data correspond to usage on the plateform after 2015. The current usage metrics is available 48-96 hours after online publication and is updated daily on week days.
Initial download of the metrics may take a while.