Fig. 6
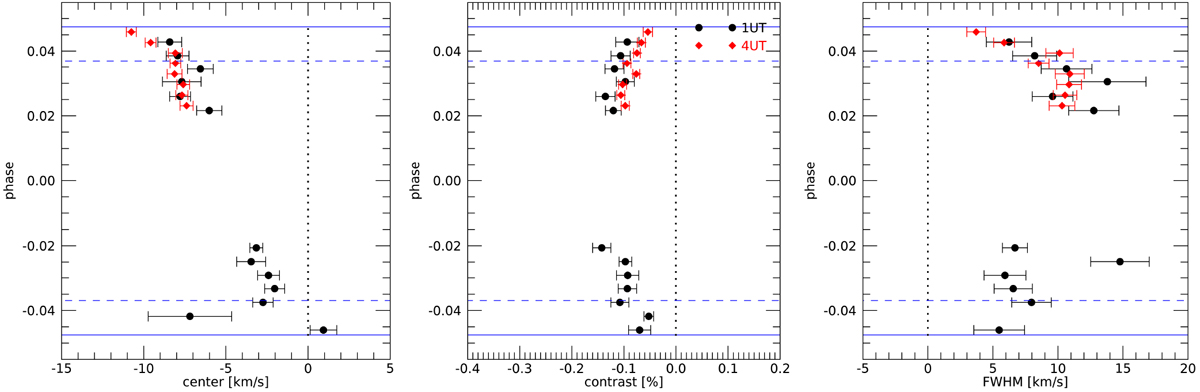
Center (left panel), contrast (central panel), and width (right panel) of the in-transit atmospheric CCFs Gaussian fits as a function of the orbital phase. Horizontal blue lines show the transit duration, dashed blue lines show the full-transit limits. Measurements are not done where the atmospheric track is superimposed on the Doppler shadow.
Current usage metrics show cumulative count of Article Views (full-text article views including HTML views, PDF and ePub downloads, according to the available data) and Abstracts Views on Vision4Press platform.
Data correspond to usage on the plateform after 2015. The current usage metrics is available 48-96 hours after online publication and is updated daily on week days.
Initial download of the metrics may take a while.