Fig. 3
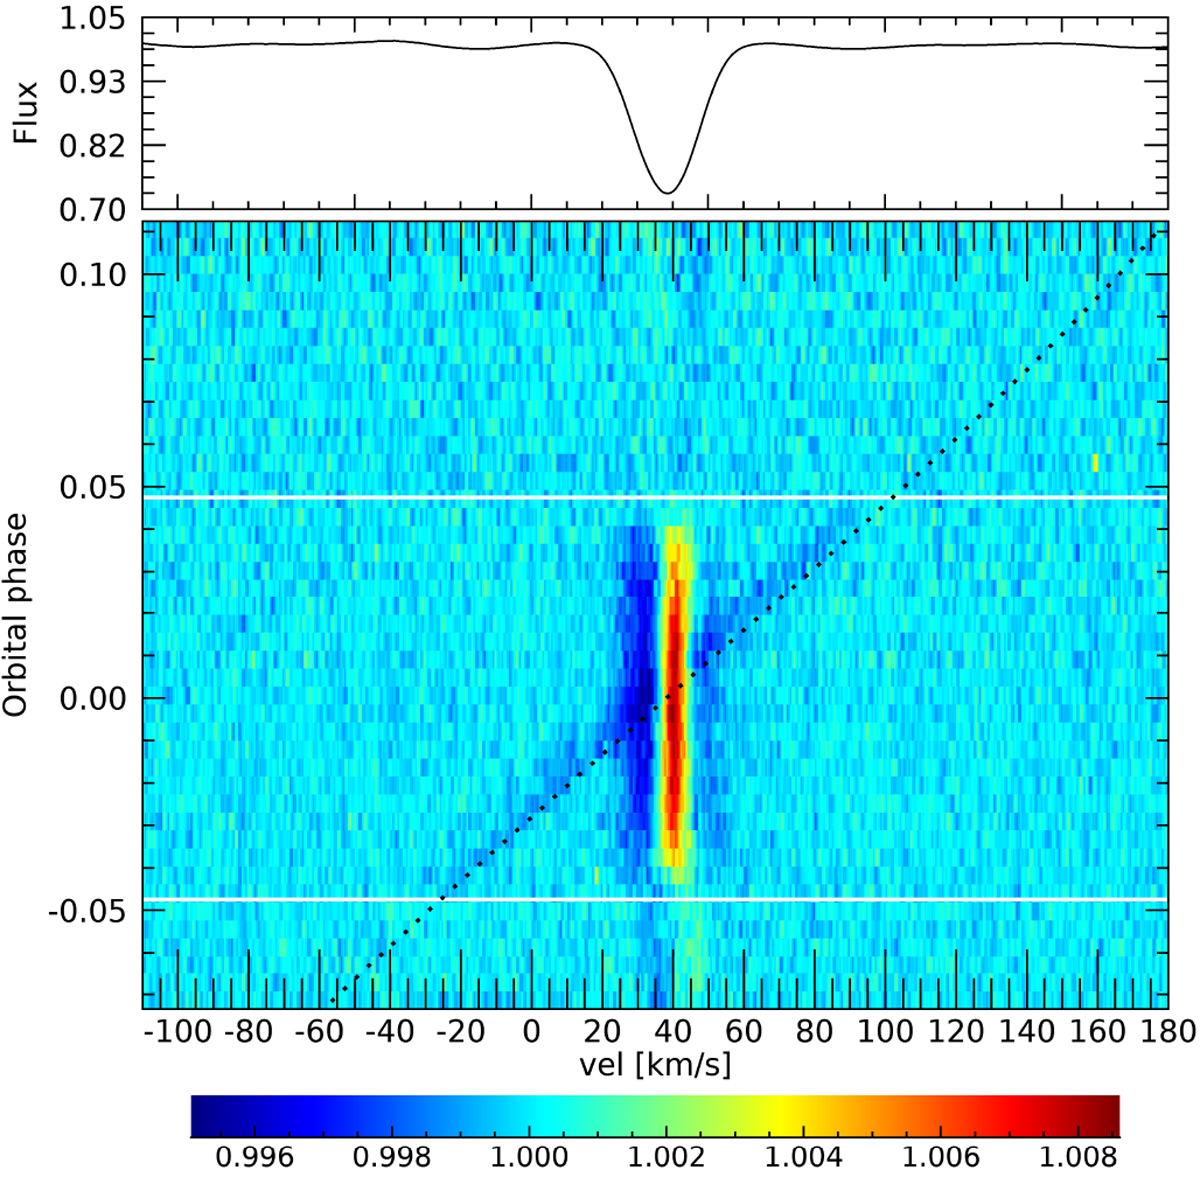
Top panel: average out-of-transit stellar CCF. Bottom panel: tomography of CCF residuals for the 1-UT transit, in the stellar restframe. The stellar systemic velocity Vsys is still not subtracted. Horizontal white lines represent the beginning and end of the transit. The dotted black line shows the theoretical planetary RV. Differences between the stellar CCF residuals before and after the transit, possibly due to stellar activity, are noticeable.
Current usage metrics show cumulative count of Article Views (full-text article views including HTML views, PDF and ePub downloads, according to the available data) and Abstracts Views on Vision4Press platform.
Data correspond to usage on the plateform after 2015. The current usage metrics is available 48-96 hours after online publication and is updated daily on week days.
Initial download of the metrics may take a while.